View
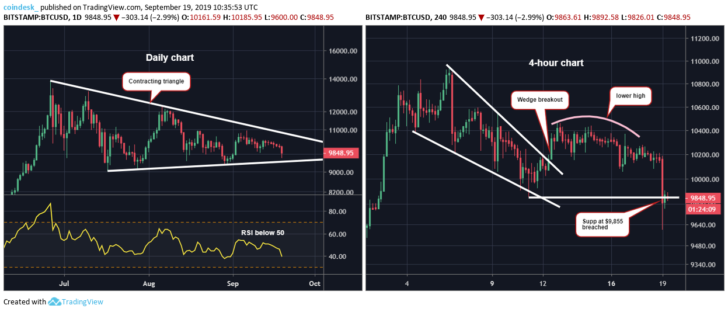
- BTC quickly fell to $9,600 this morning, bolstering the bearish setup on the 4-hour and daily charts. A deeper drop to key support at $9,454 may now be in the offing.
- A UTC close below $9,450 would confirm a downside break of a three-month-long contracting triangle and expose the 200-day moving average (MA) support lined up near $8,100.
- A move above $10,458 is needed to negate the immediate bearish case. A UTC close above $10,958 would confirm a bullish triangle breakout.
- The 50- and 100-day moving averages are about to produce a bearish crossover, a lagging indicator known to trap sellers on the wrong side of the market.
Bitcoin (BTC) slipped to an 18-day low today, as a key indicator threatens to turn bearish for the first time in a year.
The top cryptocurrency fell by $500 in 10 minutes just after 03:00 UTC to hit a low of $9,600 on Bitstamp. That level was last seen on Sept. 1.
The drop was expected as BTC was on slippery ground following last week’s failed breakout. Volatility also fell to multi-month lows on Wednesday, indicating scope for an explosive price move.
Prices have bounced back a little in the last few hours, but the bearish mood is still intact with the cryptocurrency currently changing hands around $9,850, representing a 3 percent loss on a 24-hour basis.
The spread between the 50- and 100-day moving averages (MAs) of bitcoin’s price has narrowed sharply and the two averages will likely soon produce a bearish crossover, as seen in the chart below.
A bearish crossover occurs when a short-term MA drops below a long-term MA. At time of writing, the 50- and 100-day averages are located at $10,504 and $10,492 and the former looks set to cross below the latter in the next couple of days.
If confirmed, the event would mark the first bear cross of the 50- and 100-day MAs since Sept. 16, 2018.
Technical analysis theory considers the bearish cross of long-term MAs as an advance warning of an impending price crash. They are, however, based on historical data and tend to lag price. Hence, bearish crossovers have limited predictive powers at best and often end up trapping sellers on the wrong side of the market.
For instance, the 50-day MA fell below the 100-day MA on Aug. 29, 2016, when BTC was trading near $570. The cryptocurrency remained flatlined in the next couple of days before rising above $600 on Sept. 4.
More importantly, the $570 price seen on Aug. 29 was never put to test throughout the meteoric rise to a record high of $20,000 reached in December 2017.
Observers may argue that last September’s bearish crossover was followed by a sharp sell-off to levels below $5,000 in November. However, back then, the cryptocurrency was in a bear market. Also, prices remained sidelined above $6,000 for at least six weeks following the confirmation of the bear cross before dropping in November.
Currently, BTC appears to be in a bull market, having charted higher lows and higher highs in the second quarter. Hence, the latest bearish cross may not be a cause for worry for the bulls – especially considering BTC is still stuck in a three-month-long narrowing of its price range.
Daily and 4-hour charts
The upper edge of the contracting triangle is currently located at $10,857 while the lower edge is seen at $9,450.
A high-volume UTC close above $10,857 would confirm the breakout and imply a resumption of the rally from lows near $4,000 in April and could yield a break above the 2019 high of $13,880. That said, a more reliable indicator of bullish revival would be a weekly close above $12,000.
A triangle breakdown, if confirmed, would suggest a bearish reversal and could fuel a price drop to the 200-day moving average (MA), currently located $8,139.
The 14-day relative strength index (RSI) is currently reporting bearish conditions with a below-50 reading. Further, the weekly moving average convergence divergence (MACD) histogram is hovering in bearish territory below zero.
Meanwhile, the 4-hour chart shows a failed breakout followed by a bearish lower high and a drop below key support of $9,855 earlier today.
So, the stage looks set for the test of $9,450 – the lower edge of the contracting triangle. The immediate bearish case would weaken if prices rise above $10,458 (Sept. 13 high).
Disclosure: The author holds no cryptocurrency assets at the time of writing.
Bitcoin image via Shutterstock; charts by Trading View


