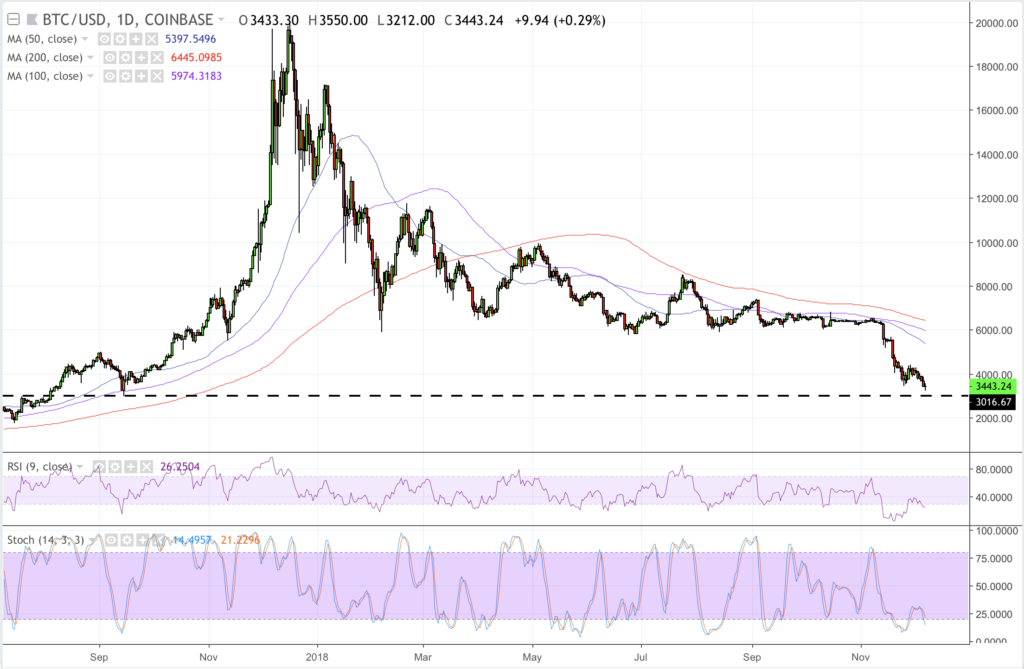
The bitcoin price on Friday plunged 6.5 percent against the US Dollar, breaking below the flagship cryptocurrency’s previous yearly low at $3,455.
The bearish cycle took another turn after the Securities and Exchange Commission (SEC) halted its decision on the VanEck’s upcoming bitcoin ETF once again. The fundamental has been treated as one of the strongest bullish catalysts for the bitcoin market, with many believing that its approval would bring a minimum of $1 billion investment into space. In case the US regulator disapproves it, the market sentiment would be equally bearish.
The BTC/USD rate was already in shock after the SEC’s decision came to the wire. It established another yearly low, this time towards 3218-fiat, threatening to overreach its downside target at $1,500 in the medium-term. However, the market noted a minor pullback action from the newfound bottom — or support. As of now, the BTC/USD pair is forming a Doji on a daily chart, indicating the bias conflict in the market.

The latest price action has slightly pushed us away from reading technical patterns and relying more on the supply and demand ratio of bitcoin as an asset. The market now looks for a balanced level that could derive the true economic nature of the cryptocurrency. Is there a demand against the constant supply in the near-term? If not, then how low can bitcoin drop to locate a bottom? Would a weak bitcoin price be any good for the mining community? So many questions, but answers are nowhere to be seen.
Psychologically, the bitcoin price is heading towards an area that once showed a huge demand for the asset. With the breach of 3455-fiat yesterday, the BTC/USD pair is now targeting 3000-fiat as the next potential bottom. In September 2017, the bulls had breached this level as resistance, only to retest it in a bearish correction action as support before pursuing a strong rebound to the north. The rejection initiated a long-term bullish run that took its last breath near 19500-fiat.
Coming back to the technicalities, BTC/USD on the daily charts is signaling a rebound. The RSI momentum indicator could slip further but would eventually bounce back from its oversold region. Similarly, the Stochastic Oscillator could also first slip and then attempt a strong reversal. We are also noticing a decline in volume that proves that bears are at a point of exhaustion at the time of this writing.
Nevertheless, let’s not misread a bullish correction as a magical rally towards the bitcoin’s all-time high. The pair would likely retest its 50-period consolidation area to establish an extended bullish bias. Unless that happens, bitcoin is unfortunately bearish.
Note: We are not placing any intraday positions due to highly risky scenarios. Kindly check back for more updates.
Featured Image from Shutterstock. Charts from TradingView.
Get Exclusive Crypto Analysis by Professional Traders and Investors on Hacked.com. Sign up now and get the first month for free. Click here.


