Bitcoin price (BTC) fell almost 5% on Monday morning, finding lows of $8,593, completely reversing the weekend recovery back above the $9,000 handle and below the lows of the prior week.
As we have seen recently, all other major cryptos have followed suit, with Ether (ETH) managing to perform better against the U.S. dollar than its peers, but still losing value.
With a poor start to the week, let’s dive into the charts to see if an end to the bleeding is in sight for Bitcoin, which continues to lead the market back down.
Cryptocurrency market daily view. Source: Coin360
Weekly Chart
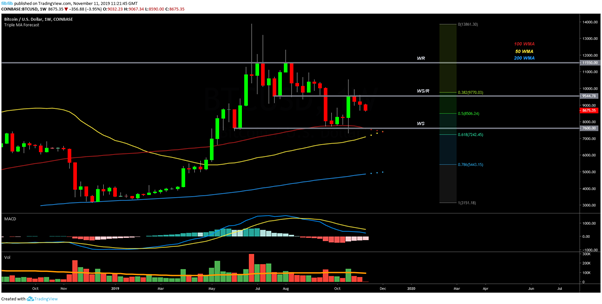
Bitcoin has suffered a sharp rejection off weekly resistance at $9,500 having failed to break the key long term resistance and support level last week.
BTC USD Weekly chart. Source: TradingView
The rejection can clearly be seen to be a continuation of the diagonal resistance on the chart, which has been a hurdle for BTC since making yearly highs of almost $14,000 in the last week of June.
The Moving Average Convergence Divergence (MACD) indicator shows that key exponential moving averages, namely the 26 and 12 EMAs, continue to cross bearish. Although, they are starting to close together as shown by the higher lows on the histogram.
This effectively means that although the price is still declining, the momentum of the drop is decreasing. The last time we saw this was at the turn of the year and was an early indication that Bitcoin might be in the early stages of finding a bottom.
Volume last week has returned to some of the lows seen for the year, meaning that the price may need to return lower to find interest from the bulls as clearly the bears remain in control with lower major highs on the weekly chart being the continued theme.
The 50 and 100 moving averages remain on track to cross in three weeks and will do so at the key weekly support level of $7,600. Should Bitcoin have underlying bullish sentiment for the remainder of the year, the bulls should make a response by the end of November.
Daily chart
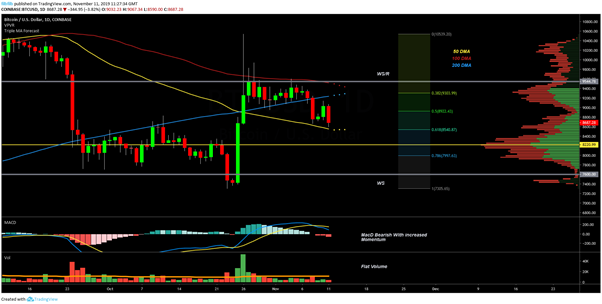
Moving down the timeframes to the daily chart, we can see that Bitcoin lost the support of the 200 daily moving average (DMA) and effectively fell through the gap in the Volume Profile Visible Range (VPVR) where there was a lack in volume at the $8,700-9,000 interval.
BTC USD Daily chart. Source: TradingView
The 50 DMA has now propped up the price just above the 61.8% retracement of the move, which took Bitcoin back up to retest the $10K level. This is likely to play a key role this week; failure here would mean price being sent back to retest the previous level of volume interest around the point of control at $8,250.
The bearish cross of the MACD with lower lows on the histogram is implicit of increasing bearish momentum going into the start of the week.
4-hour chart
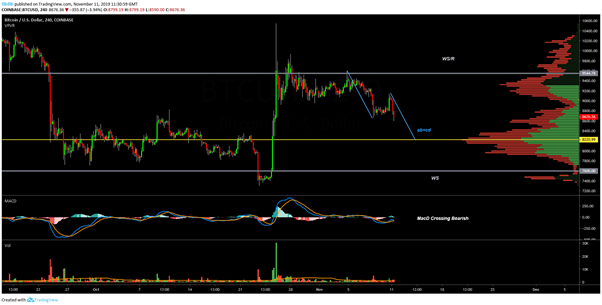
The 4-hour chart is useful in highlighting the bearish objective; an AB=CD completion of the down move into the mid $8,200s where much of the volume was recently seen. The MACD on the 4-hour chart is also in the process of crossing bearish, which adds weight to the idea that price can still go lower.
BTC USD 4-hour chart. Source: TradingView
Should the bulls be able to break the bearish momentum this week, the major challenge will be to retake the $9,500 weekly resistance, which will be an extremely significant move should that be the case.
An early sign that this would be on the cards would be a daily close across $9,000, which would receive some follow-through.
Bitcoin spot USD order book
BTC USD Combined order book. Source: Data.bitcoinity.org
The visual representation of the order book shows that there is a lot of buying interest for the bulls above the $8,000 level and outweighs the selling interest overall.
While this can be somewhat misleading due to hidden and market orders, it is somewhat indicative of there being some interest by the bulls at the key levels talked about above in the low $8,000s and the bears may run out of interest as price moves back towards the weekly support levels.
Bulls must hold $8K levels
With the bulls under pressure, all eyes will be on the $8,000 handle this week if the bears manage to push the price lower. If bulls can defend this level for the remainder of the month, we may see a response as the key 50 and 100 moving averages converge in the final week of November.
Should this be the case, there may be a good chance that Bitcoin will have a stronger close to the year. Bitcoin typically makes major moves in December, either bottoming or finding a top so it will be an interesting period with a little over five months to go before the Bitcoin halving takes place.
The views and opinions expressed here are solely those of the author and do not necessarily reflect the views of Cointelegraph. Every investment and trading move involves risk. You should conduct your own research when making a decision.


