CCN is expanding. Are you our next full-time journalist from the West Coast USA? Send us your CV and examples here.
The bitcoin price on Sunday surged as high as 7.28 percent against the US dollar ahead of the US session.
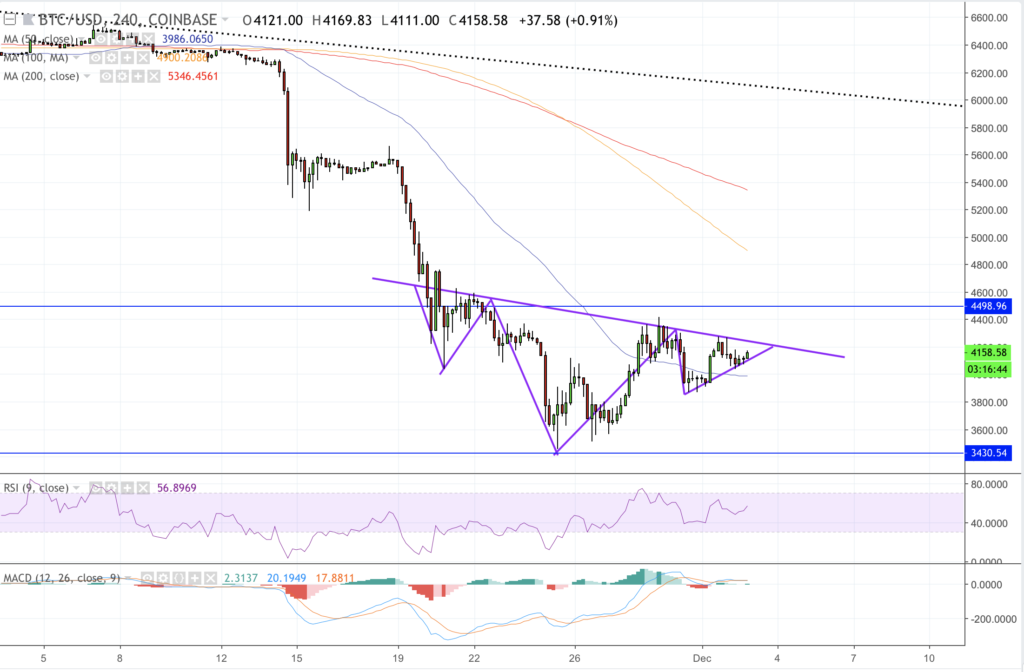
The BTC/USD rate is trading at 4158-fiat at press time. The pair is almost completing the formation of an inverse head and shoulder pattern. Its neckline appears more like a near-term falling trendline, capping the strong upside movements lately. The latest jump in BTC/USD has affirmed what bulls are attempting to break at this point. Breaking above the neckline level sets up a run towards 4500-fiat. The resistance level is psychological at best, and its invalidation could also confirm an extended upside action towards 5000-fiat.

As of now, traders can wait for BTC/USD to close above the neckline in hopes to validate if the breakout is valid or false. This strategy can allow traders to go long towards their respective near- or long-term upside targets. Alternatively, traders can also place a limit order at or just below the neckline, so as to get an execution on a bitcoin price rebound.
Other than inverse H&S formation, the technical dynamics of the bitcoin market is mostly bullish in near-term. The BTC/USD pair is trading above the 50-period moving average. The RSI momentum indicator is close to 60, awaiting a jump to validate a stronger bullish bias. The MACD indicator is also inside a positive territory.
At the same time, people may start believing that the bitcoin price has bottomed out. While the market has certainly located a near-term support at 3430-fiat, a bottom cannot be confirmed unless we have a steady break and consolidation period above 4500-fiat.
BTC/USD Intraday Analysis

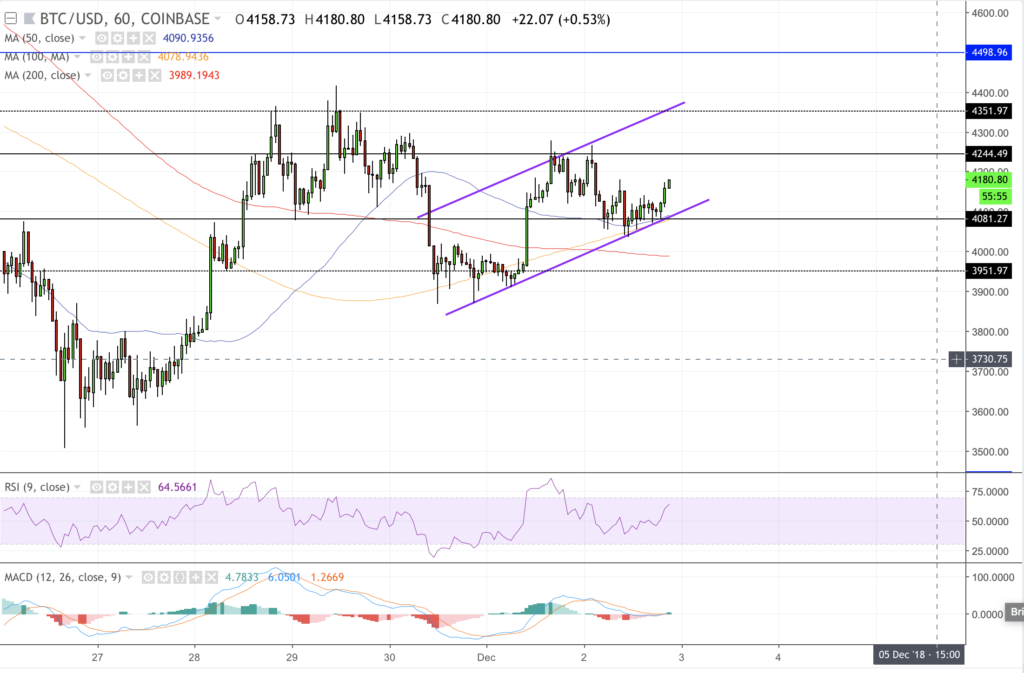
Coming to our intraday analysis, we are as usual placing our bets based on parameters defined by today’s price action. The BTC/USD index is comfortably trending upwards inside a rising parallel channel, giving us cues of potential entry and exit positions on each bounce and pullback action within the zone.
Our interim resistance is currently located at 4244-fiat while our interim support is at 4081-fiat. The latest bounce from the support line has allowed us to enter a long position towards 4244-fiat, according to our intrarange strategy. At the same time, we have placed a stop loss order at 4059-fiat to minimize our losses if the trend reverses.
Upon achieving the intrarange long target, we will put our focus on the channel resistance coinciding with 4351-fiat, our upside target. Thus, a break above the resistance level would have us open a long order towards 4351-fiat. We’ll maintain our risk management strategy by maintaining a stop loss order at 4222-fiat to exit the market on a small loss if a strong pullback appears.
Looking to the downside, a break below the channel support would have us enter a short position towards the 200-period simple moving average while eyeing 3951-fiat in the event of an extended breakdown session. A stop loss at 4124-fiat will define our risk management strategy in this position.
Featured Image from Shutterstock. Charts from TradingView.
Get Exclusive Crypto Analysis by Professional Traders and Investors on Hacked.com. Sign up now and get the first month for free. Click here.


