View
- Bitcoin’s defense of $3,700 is encouraging, but a positive follow-through is needed soon to invalidate a bear flag pattern that has developed on the hourly chart.
- A UTC close below $3,714 would validate Sunday’s bearish outside reversal candle and confirm a bullish-to-bearish trend change. The probability of BTC closing today below $3,714 would rise if the cryptocurrency drops below $3,764 in the next few hours confirming a bear flag breakdown.
- A bear flag breakdown, if confirmed, would open the doors to levels below $3,400.
- On the higher side, a move above $4,190 (Sunday’s high) is needed to revive the bullish view.
Bitcoin risks a further sell-off if the bulls’ defense of $3,700 fails to produce quick recovery.
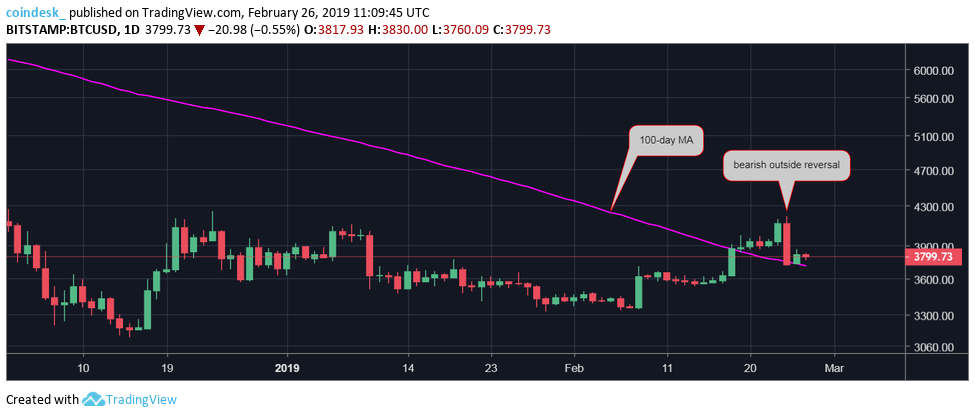
The leading cryptocurrency by market capitalization created a big bearish outside reversal candle on Feb. 24, weakening the bullish case put forward by last week’s high-volume breakout above $3,800.
The sell-off was likely driven by the unwinding of long positions (profit taking), as the notional value of short positions fell 12 percent to 11-month lows, according to Bitfinex. Notably, the long-short ratio, a barometer of market sentiment, is still holding near the high of 1.5 seen earlier this month. Further, the bullish higher low of $3,550 set on Feb. 17 is intact.
Therefore, the path of least resistance is still to the higher side. So far, however, the bulls have not taken the advantage of better entry levels offered by Sunday’s price drop, leaving the cryptocurrency directionless around $3,800.
That said, the upside needs to gather traction soon as the short duration technical studies are turning bearish and a break below $3,700 could yield deeper losses.
As of writing, BTC is changing hands at $3,800 on Bitstamp, representing 0.5 percent gain on a 24-hour basis.
Hourly chart
BTC seems to have carved out a bear flag on the 4-hour chart, which often ends up accelerating the preceding bearish move.
An hourly close below $3,764 – the confluence of the lower edge of the flag and the rising trendline – would confirm the flag breakdown and with RSI back in the undersold territory (50-30), there is enough room for a drop to levels below $3,400 post-breakdown.
The chart also shows a bearish crossover between the 50- and 200-hour MAs, which would gain credence if the cryptocurrency fails to pick up a strong bid in the next few hours.
Daily chart
A UTC close below $3,714 would validate both the downward sloping 100-day moving average (MA) and Sunday’s bearish outside day candle and confirm a short-term bullish-to-bearish trend change. That could be followed by a drop to $3,531 carved out on Feb. 14.
The probability of BTC witnessing a bearish close below $3,714 would rise if prices confirm a flag breakdown with a move below $3,764 in the next few hours.
Disclosure: The author holds no cryptocurrency assets at the time of writing.
Bitcoin image via Shutterstock; charts by Trading View


