Bitcoin Price Loses Strength Under $12K, but Expect More Volatility
July 8, 2019 by Ramiro Burgos
The bitcoin price lost some of its upward momentum last week, struggling to stay above $12,000 USD for long but not dropping far. Read our weekly technical analysis to decide if that means optimism… or otherwise. We’d also love to hear your own thoughts in the comments or on social media.
Also read: Bitcoin Price Going Sideways Around $12K as Volatility Increases
Subscribe to the Bitsonline YouTube channel for great videos featuring industry insiders & experts
Bitcoin Price Technical Analysis
Long-Term Analysis
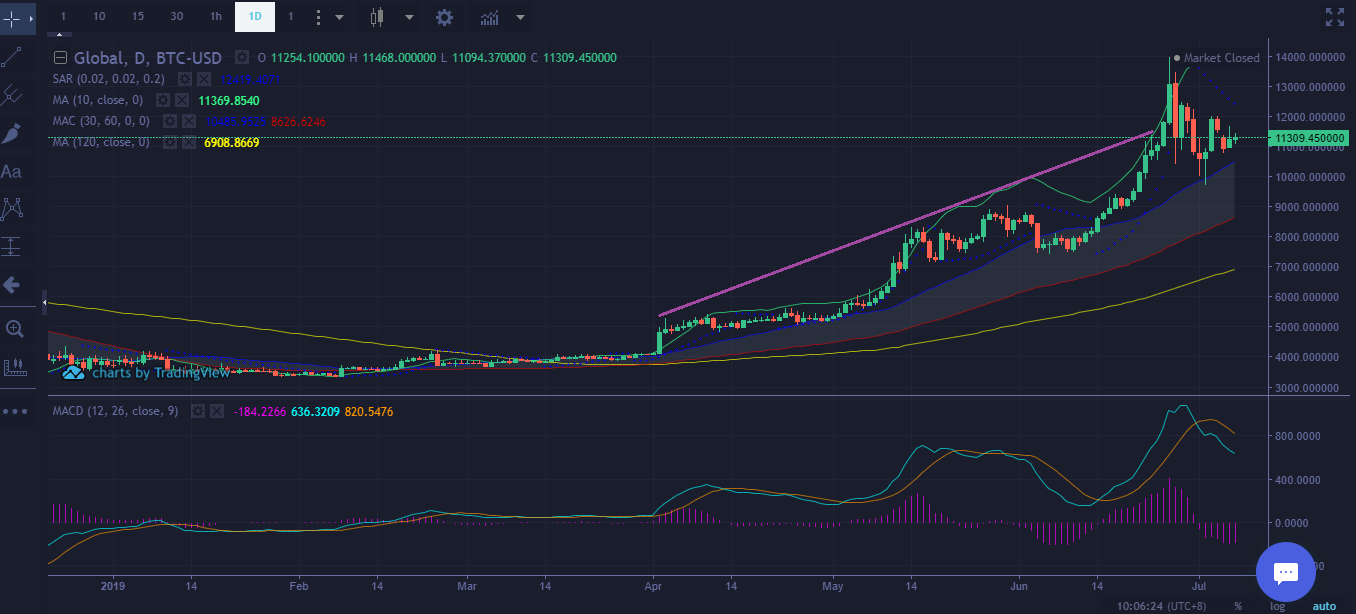
The bitcoin price has retreated below its $12,000 resistance level, and the upward movement has started losing strength. While volatility has increased to define a wider range for high and low quoting action to include prices over $16,000, it has also re-activated lower support levels at $9,000 and $7,000.
External factors are motivating the Bullish Consensus without grounds, but opinions and wishful thinking about the future from personalities in the media and on social networks are a contributing factor. This is sustaining the recently-started Optimism phase instead, dialing back the recent Hope one and keeping the market safe from Disbelief according to Mass Psychology Analysis — but this depends on values staying over $10,000.
Mid-Term Analysis
Mathematical Indicators which backed the upward movement to $14,000 are flipping down, harming the bullish trend and delaying the rise to higher levels. If quotes sustain the action between $12,000 and $10,000 when volatility swing the quotes up and down, a lateral market would sustain the bullish trend while indicators recover themselves.
A new resistance at $12,000 could became a new trigger on the way up, and our next target level to consider should be $16,000. On the other hand, if values brake down to $10,000, the bitcoin price could re-enter its former lateral market between $9,000 and $7,000, canceling temporarily the upper targets.
Short-Term Analysis
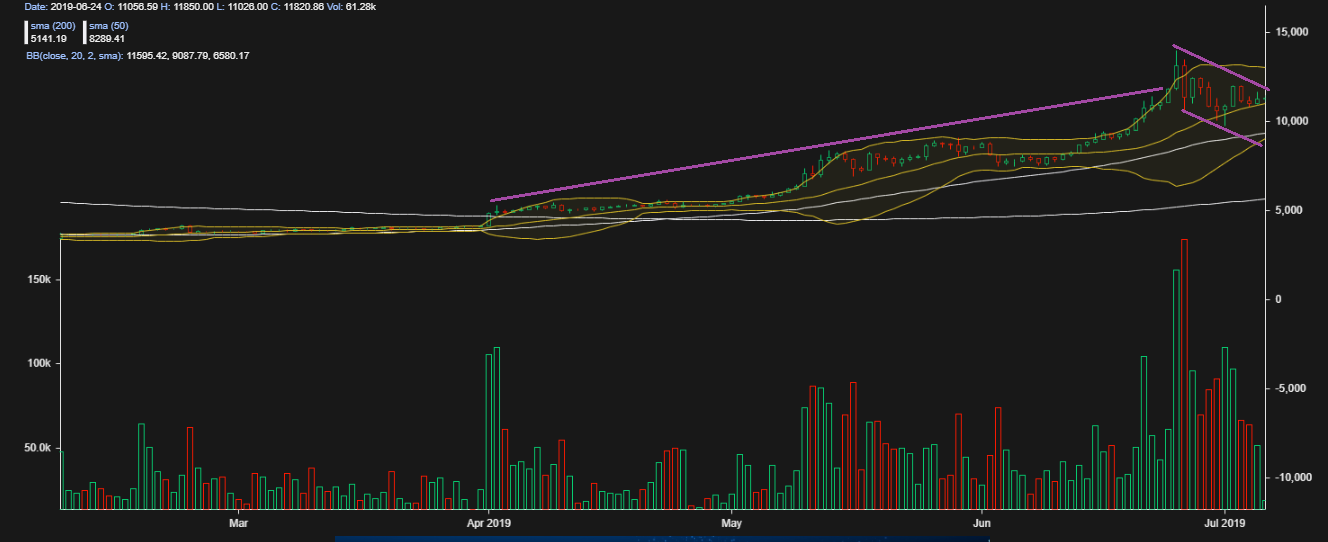
According to Japanese Candlestick Analysis, Offer´s Crows stopped Soldiers from demand confirming a new battlefield between the $10,000 and $12,000 level. According to Bollinger Bands Analysis, the current pattern takes prices into a sideways movement, sustaining newly-conquered levels.
A triangle formation gave way to a mini bearish channel, canceling the consensus idea for a rise to $16,000 until the lateral market consolidates present levels and mathematical indicators are ready to back another upward movement. We can expect the first support to be around $9,000.
What do you think will happen to the bitcoin price? Share your predictions in the comments below.
If you find Ramiro’s analyses interesting or helpful, you can find out more about how he comes to his conclusions by checking out his primer book, the Manual de Análisis Técnico Aplicado a los Mercados Bursátiles. The text covers the whole range of technical analysis concepts, from introductory to advanced and everything in between. To order, send an email to [email protected]
Image via Pixabay
This technical analysis is meant for informational purposes only. Bitsonline is not responsible for any gains or losses incurred while trading bitcoin.


