View
- Bitcoin jumped to one-month highs earlier today, validating the falling wedge breakout seen in the 4-hour chart on Friday.
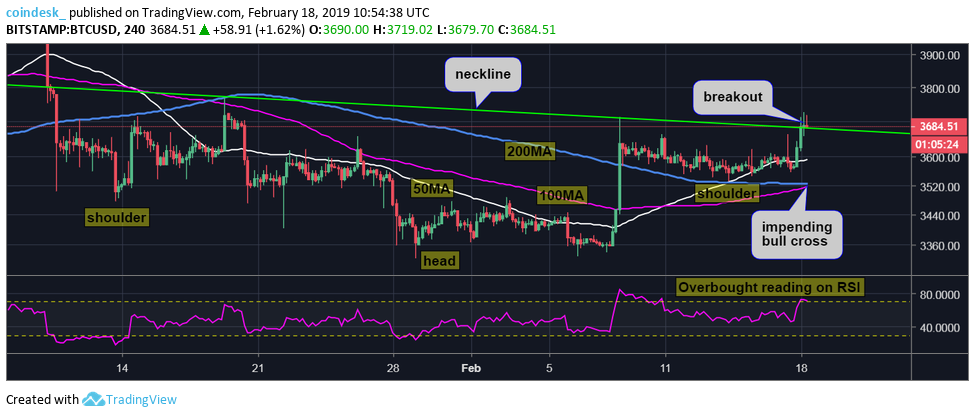
- The outlook as per the daily chart remains neutral, as the cryptocurrency is still trapped in a symmetrical triangle. That said, a break above the upper edge of the triangle, currently located at $3,760, looks likely as an inverse head-and-shoulders breakout on the 4-hour chart has opened up upside toward $4,030 (target as per the measured height method). More importantly, the rally to one-month highs is backed by strong volumes and a rise in long positions.
- A symmetrical triangle breakout, if confirmed, would imply a bearish-to-bullish trend change on the daily chart.
- A failure to cross the triangle resistance at $3,760 would weaken the bullish case. The focus would again shift to the recent lows near $3,300 if the support at $3,530 (low of the left shoulder) is breached.
Bitcoin’s high-volume move to one-month highs could be the start of a stronger rally to above key resistance near $3,760.
The leading cryptocurrency by market capitalization rose to $3,727 at 07:00 UTC, the highest level since Jan. 19, according to Bitstamp data, validating Friday’s falling wedge breakout.
With a move to levels above $3,700, bitcoin has also witnessed an inverse head-and-shoulders breakout on the 4-hour chart – indicating a bearish-to-bullish trend change – and has opened up upside toward $4,000.
On the way higher, however, BTC could encounter stiff resistance near $3,760 – the upper edge of a contracting triangle (higher lows and lower highs) carved out over the last eight weeks. A failure to take out that hurdle would weaken the short-term bullish case.
That said, BTC is likely to cross that resistance this week, as the rally to one-month highs is backed by a pickup in both trading volumes and long positions (bullish bets).
Bitcoin’s 24-hour trading volume has jumped to highs above $8 billion for the first time since Dec. 20, according to CoinMarketCap data.
Further, BTC/USD longs on Bitfinex rose to 38,237 BTC earlier today – the highest level since March 30, 2018. Notably, long positions are still down at least 7 percent from record highs above 40,000 BTC witnessed in March last year. Therefore, the probability of a “long-squeeze” – a sudden price drop due to the unwinding of long positions – is quite low.
So, the odds of BTC confirming the contracting triangle breakout with a move above $3,760 appear high. As of writing, the cryptocurrency is changing hands at $3,700 on Bitstamp, representing a 3 percent gain on a 24-hour basis.
Daily chart
A bearish-to-bullish trend change on the daily chart would be confirmed if prices see a UTC close above the upper edge of the symmetrical triangle, currently at $3,760.
That looks likely as the 14-day relative strength index (RSI) is currently located at 61.00, the highest level since September. Further, the 5- and 10-day moving averages (MAs) are trending north indicating a bullish setup.
4-hour chart
The inverse head-and-shoulders breakout seen in the 4-hour chart indicates scope for a rally to $4,030 (target as per the measured height method).
Key averages are beginning to align in favor of the bulls too. The 50-candle MA is now sloping upwards and the 100-candle MA looks set to cross the 200-candle MA from below forming a bullish crossover.
The RSI, however, is reporting overbought conditions. Hence, a minor bout of consolidation or pullback could be seen before the contracting triangle resistance at $3,760 is breached.
Disclosure: The author holds no cryptocurrency assets at the time of writing.
Bitcoin image via Shutterstock; charts by Trading View


