Bitcoin price is back at nearly $57,000 and is less than $10,000 away from a new setting a new all-time high and heading back into price discovery mode.
It is also moments away from re-entering the RSI bull zone, which in the past has led to cryptocurrency cycle climaxes and a bear market to follow. Here is a closer look and what to watch for.
Bitcoin Price Readies Aggressive RSI “Bull Zone” Reentry
Bitcoin price action doesn’t behave like other assets. Its speculative nature helps it to follow technical analysis well, but remains highly volatile.
But in some cases, when FOMO begins, even technical indicators begin to behave irrationally. The Relative Strength Index, for example, is an oscillator that tells a trader when an asset is oversold or overbought. The idea is that when a reading is above 70 an asset is overbought and nearing the end of its trend.
Related Reading | How 90-Year Old Market Wizardry Predicted The Bitcoin Breakout
On lower timeframes, this can help to find short-term tops, but on higher timeframes, going above 70 tends to signal that bulls are out in full force, and very little will stop them.
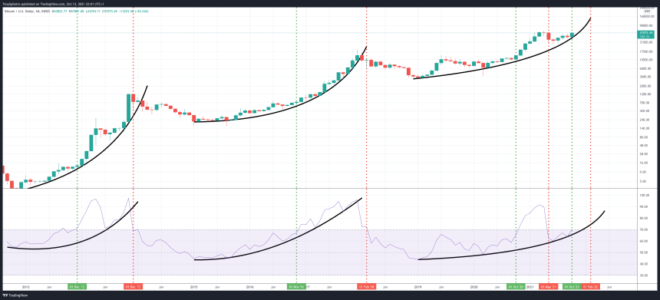
Bitcoin is about to reach above 70 on the RSI | Source: BTCUSD Index on TradingView.com
The same monthly timeframe also shows another anomaly: Bitcoin price has never gone into oversold territory according to the monthly RSI.
This is all happening while both Bitcoin price and the RSI itself are beginning to build upon a parabolic base. All this behavior suggests that the cycle isn’t over, and another wave up is about to ensue.
The Trend Line Separating A Bull And Bear Market
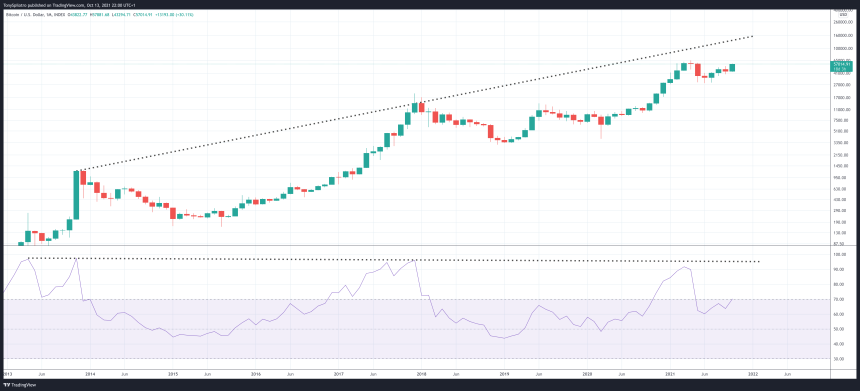
A different look at the RSI and a descending trendline, drawn with a dotted line below, could provide a clue as to where the trend will end. Falling back below a reading of 70 will confirm a bear market is here.
Could BTC top out at the descending RSI trend line? | Source: BTCUSD Index on TradingView.com
The reentry into the bull zone should cause bulls to take control over Bitcoin price once again, but is contingent upon a monthly close above a reading of 70 to ignite the spark.
Pushing through beyond $65,000 to a new all-time this month would do the trick. If that happens, parabola should take the top cryptocurrency by market cap closer to $80,000 per coin.
Related Reading | Bulls Regain Control Over Bitcoin Trend Strength: What To Expect
That would leave very little room between that level and the promised land of $100,000 and above – where the coming mania will likely come to an abrupt end, much like the same RSI has shown happens at the conclusion of each cycle.
Falling below 70 during this cycle will either be a bear trap that is confirmed this month, or the shortest time spent on the bull zone in Bitcoin’s entire history – which one is it?
Follow @TonySpilotroBTC on Twitter or via the TonyTradesBTC Telegram. Content is educational and should not be considered investment advice.
Featured image from iStockPhoto, Charts from TradingView.com


