View
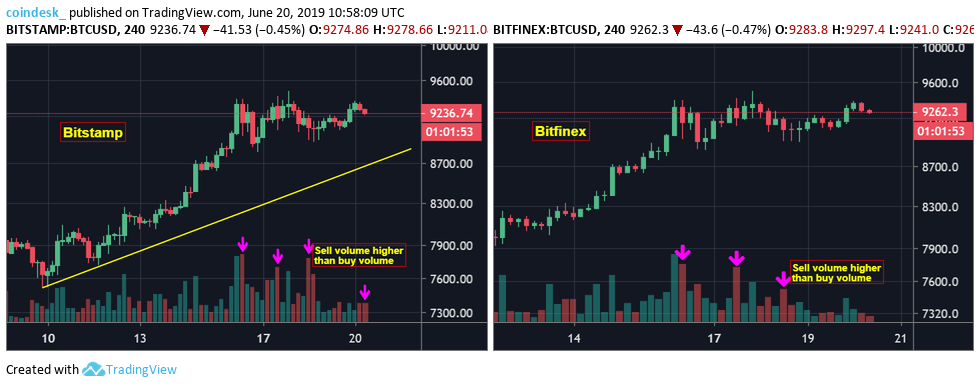
- The bitcoin price rally seems to have stalled near $9,300 with the price-volume analysis suggesting scope for a minor pullback to $9,000-$8,700.
- Record open interest in bitcoin futures listed on the Chicago Mercantile Exchange indicates a surge in institutional interest. So, pullbacks, if any, will likely be short-lived.
- The long-term technical charts indicate scope for a rally to $10,000 and above.
Bitcoin (BTC) is struggling to find acceptance above $9,300 even as futures listed on the Chicago Mercantile Exchange (CME) are witnessing record open bets.
The top cryptocurrency by market value is currently trading at $9,250, having hit a high of $9,362 earlier today, according to data source CoinMarketCap.
Notably, the cryptocurrency has failed at least two times in the last four days to hold on to gains above $9,300.
For instance, prices hit a high of $9,318 at 08:00 UTC on June 16 only to fall back to $9,040 by 10:00 UTC. Similarly, the rise to $9,366 seen in the U.S. trading hours on June 17 was short-lived with prices falling back to $9,000.
While bitcoin bulls seem to be having a breather, the open bets in CME futures have hit record highs for two consecutive days.
The open interest – the number of contracts or commitments outstanding in futures at a given point of time – jumped to a record high of 5,311 contracts or $250 million on June 17 and hit a new lifetime of 5,391 on the following day.
It is worth noting that open bets have continued to rise along with the price this year and are currently up almost 80 percent from the levels seen in June 2018.
A rise in open interest along with the rise in price mostly indicates long (buy) positions are being built up. As a result, bitcoin’s recent rally looks sustainable – more so, as the CME has associated record open bets with an increased institutional interest in the leading cryptocurrency.
Further, JPMorgan Chase recently pointed to the difference between trading volumes on cryptocurrency exchanges and CME as a sign of increased institutional activity in bitcoin.
Therefore, the cryptocurrency looks set to test $10,000 and may possibly break higher, as suggested by long-term technical charts below.
Monthly chart
The falling channel breakout confirmed in April indicates the path of least resistance is to the higher side. It is worth noting that a similar bearish channel breakout in October 2015 was followed by a 2.3-year bull run.
Also supporting the case for a rise to $10,000 and above is the bullish crossover of the 5- and 10-day moving averages.
The long-term bullish outlook would be invalidated if the price finds acceptance below May’s low of $5,350, although that looks unlikely.
That said, the rise to $10,000 could be preceded by a temporary price pullback.
4-hour chart
The above chart shows sell volumes (red bars) have been bigger than buy volumes (green bars) over the last four days on major exchanges included in the calculation of Bitwise’s “real” bitcoin trading volume.
As a result, the price may fall back below the support at $9,000. That would expose the ascending trendline, currently located at $8,690.
The case for a pullback would weaken if the price finds acceptance above $9,300 on the back of high volumes.
Disclosure: The author holds no cryptocurrency at the time of writing
Bitcoin image via CoinDesk archives; charts by TradingView


