View
- Bitcoin’s repeated failure to produce a strong bounce from key support indicates the bullish sentiment has fizzled somewhat.
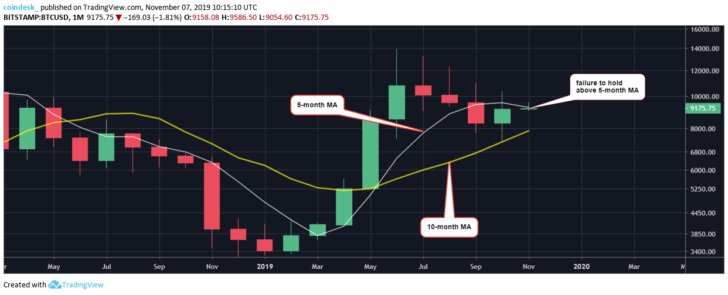
- Failure to hold above a bearish MA on the longer-term chart indicates scope for a deeper drop.
- BTC risks falling to $8,800 in the short-term and may extend the decline to $8,500.
- A high-volume triangle breakout on a 4-hour chart would be bullish, although that looks unlikely at press time.
Bitcoin is struggling to revive its stalled rally and could soon roll over to deeper support levels below $9,000.
The top cryptocurrency picked up a bid near $7,500 on Oct. 25 and jumped to $10,350 on the following day, according to Bitstamp data. The breakout into five figures, however, was short-lived, as prices quickly fell back below $10,000 on Oct. 28 and have remained largely trapped in a narrow range of $9,600–$9,000 since.
Downside has been restricted so far by the 200-day average – a barometer of long-term market trends. A pullback typically reverses from key support levels like the 200-day MA, especially if volumes are low, as has been the case recently.
So far, however, the cryptocurrency has failed to produce a strong bounce from the support, despite positive seasonality.
Prices jumped more than $400 to $9,586 from the MA on Nov. 4 only to surrender gains on the following day. A similar weak bounce has been observed in the last 24 hours or so with prices rising to $9,450 only to dive back to lows near $9,200.
These shallow bounces indicate bullish sentiment generated by the sharp rise to $10,350 has weakened and the market may test dip demand by revisiting levels below $9,000.
As of writing, BTC is changing hands at $9,170 on Bitstamp, representing a 1.50 percent drop on a 24-hour basis.
Daily chart
BTC’s upside has been capped by the trendline connecting June 26 and Aug. 6 lows multiple times in the last few days. Meanwhile, the cryptocurrency has tested the 200-day MA support five times in eight days.
Trading volumes have fallen sharply since the recent drop-off from $10,350. Low-volume pullbacks are often reversed, but a decent bounce continues to remain elusive.
All-in-all, the cryptocurrency looks set for a drop to the former resistance-turned-support of $8,800.
Monthly chart
The upper shadow of the monthly candle represents rejection above the 5-month MA at $9,265. A failure to hold above descending averages usually translates into a notable price drop. Major support is seen at the ascending 10-month MA near $8,000.
4-hour chart
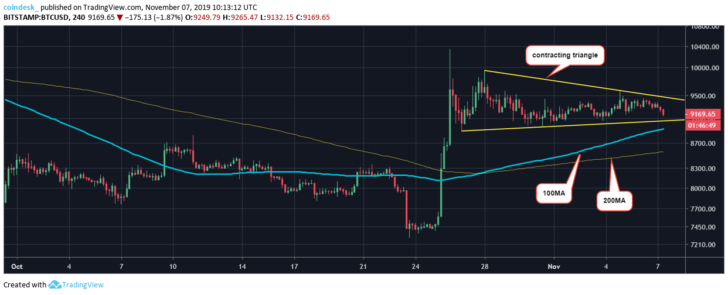
The contracting triangle seen above looks likely to be breached to the lower side, as suggested by the daily and monthly indicators.
The ascending 100- and 200-candle MAs, currently at $8,928 and $8,558, respectively, could offer support if a drop out of the zone is confirmed.
The bearish view would be invalidated if the triangle ends with a high-volume bullish breakout. In that case, a retest of $10,000 could be seen.
Disclosure: The author holds no cryptocurrency assets at the time of writing.
Bitcoin image via Shutterstock; charts by Trading View


