View
- Bitcoin has printed a 5.5-month high of $5,714 today, reinforcing the bullish view put forward by the cryptocurrency’s recent bounce from the 30-day moving average and April’s bullish close above the 21-month exponential moving average.
- BTC appears on track to test the psychological resistance of $6,000 soon.
- A UTC close below the 30-day MA at $5,221 would abort the short-term bullish setup.
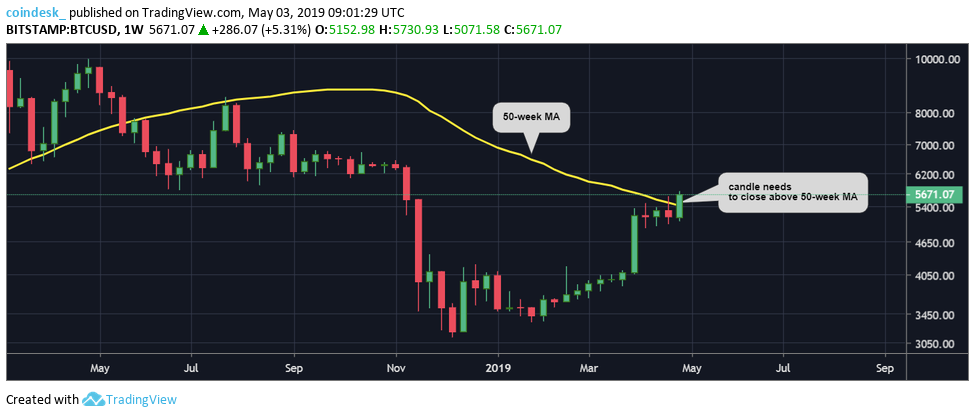
- A failure to secure a weekly close (Sunday, UTC) above the 50-week moving average, currently at $5,418, could invite profit taking, yielding a fall back to $5,000.
Bitcoin’s (BTC) price hit 5.5-month highs above $5,700 soon before press time, bolstering both short- and long-term bullish views.
The cryptocurrency market leader rose to $5,714 at 08:340 UTC, the highest level since Nov. 18, according to CoinDesk’s Bitcoin Price Index. BTC was last seen trading at $5,682, representing a 5.6 percent gain on a 24-hour basis.
The rally to 5.5-month highs has strengthened the bullish case put forward by the cryptocurrency’s recent bounce from the crucial 30-day moving average (MA) after a drop when the recent Bitfinex controversy hit the news.
Further, it validates April’s bullish close above the former support-turned-resistance of the 21-month exponential moving average of the price.
Last but not the least, with the recent bounce from levels below $5,000, the cryptocurrency has invalidated a strong bearish indicator pattern, as seen in the chart below. As a result, prices could rise to $6,000 over the next few days.
Daily chart
As seen above (prices via Bitstamp), the 30-day MA has lived up to its reputation of being strong support by reversing the price pullback from highs above $5,600 to $5,000.
More importantly, with the bounce, the relative strength index (RSI) seems to have found acceptance above the descending trendline, representing a bearish divergence confirmed on April 24.
In the past, BTC has suffered significant price pullbacks following the confirmation of the bearish divergence of the RSI. This time, however, the pattern failed – a sign of strong bullish sentiment.
What’s more, the Chaikin money flow index, used to measure the money flow volume over a set period of time (usually 21 days), has risen from 0.0036 to 0.12 in the last few days, confirming the uptrend in price.
So, BTC could close well above the April 23 high of $5,627 today, further strengthening the case for a rally to $6,000.
On the way higher, BTC may encounter resistance at $5,780 (June 2018 bottom) and $5,880 (August 2018 bottom), as discussed yesterday.
Weekly chart
Bitcoin has breached the 50-week MA resistance, currently at $5,418, on the weekly chart. However, confirmation of the breakout is needed in the form of a close above $5,418 on Sunday (UTC).
The case for a pullback to levels below $5,000 would strengthen if the buyers fail to keep prices above the key average for the second week.
Disclosure: The author holds no cryptocurrency assets at the time of writing.
Balloon image via Shutterstock; charts by Trading View


