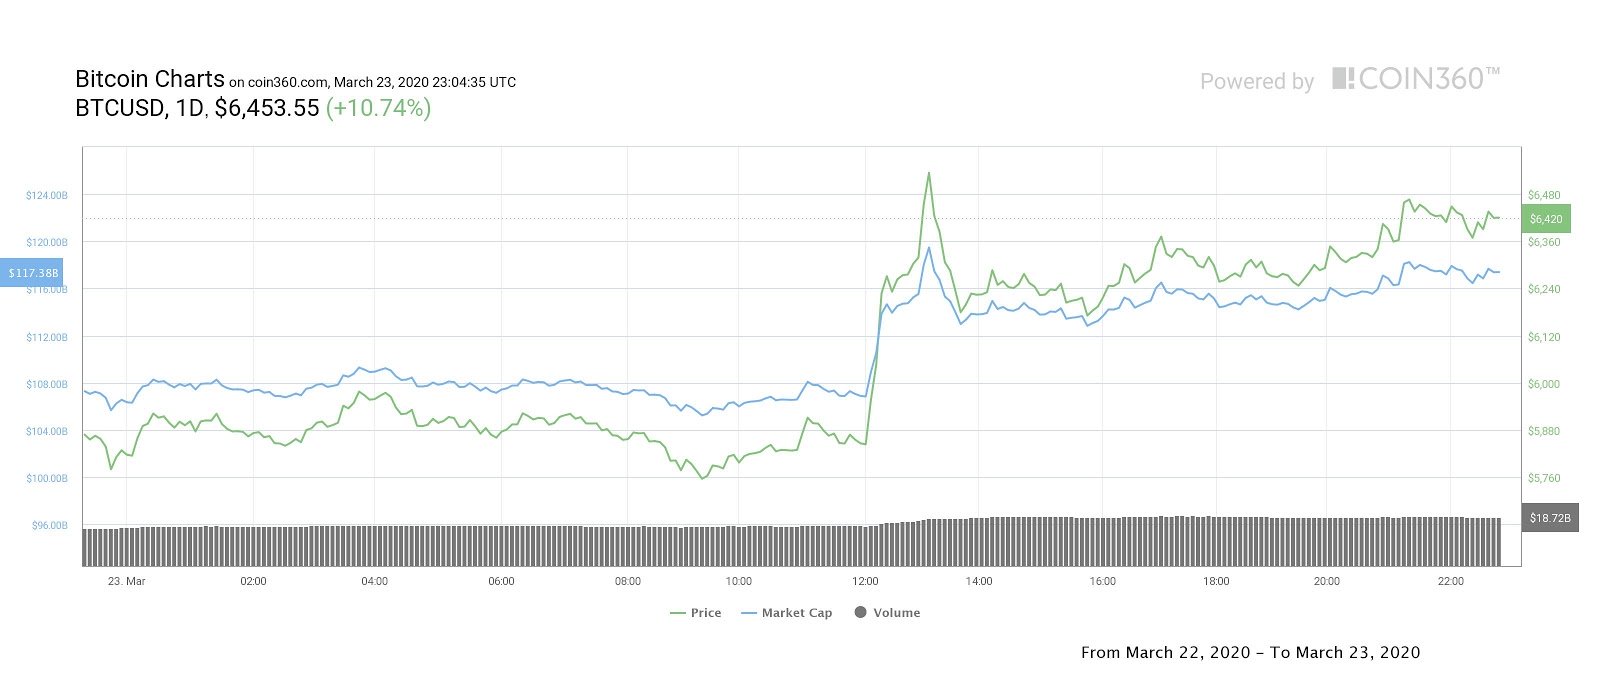
Bitcoin (BTC) price perked up today, rallying from $5,688 to a daily high at $6,600. The digital asset defied the worst fears of analysts by holding above the $5,400 support and currently Bitcoin continues to show growing strength in the face of wilting equities markets.
Interestingly, gold and silver prices also rallied 4.42% and 5.94% as the S&P500 and Dow closed the day with moderate losses. This could indicate that market participants who recently exited their stock positions could be looking for shelter and growth in store-of-value assets.
Thus, crypto investors will be closely watching to see if Bitcoin’s price action separates itself from that of traditional markets.
Crypto market daily performance. Source: Coin360
At the time of writing, bulls are defending the $6,400 resistance in order to secure a daily close above the resistance. For days now, analysts have advised that the $6,400 resistance needs to turn support and while today’s rally to $6,600 is encouraging, traders will be watching to see if there is enough purchasing volume to support the current momentum.
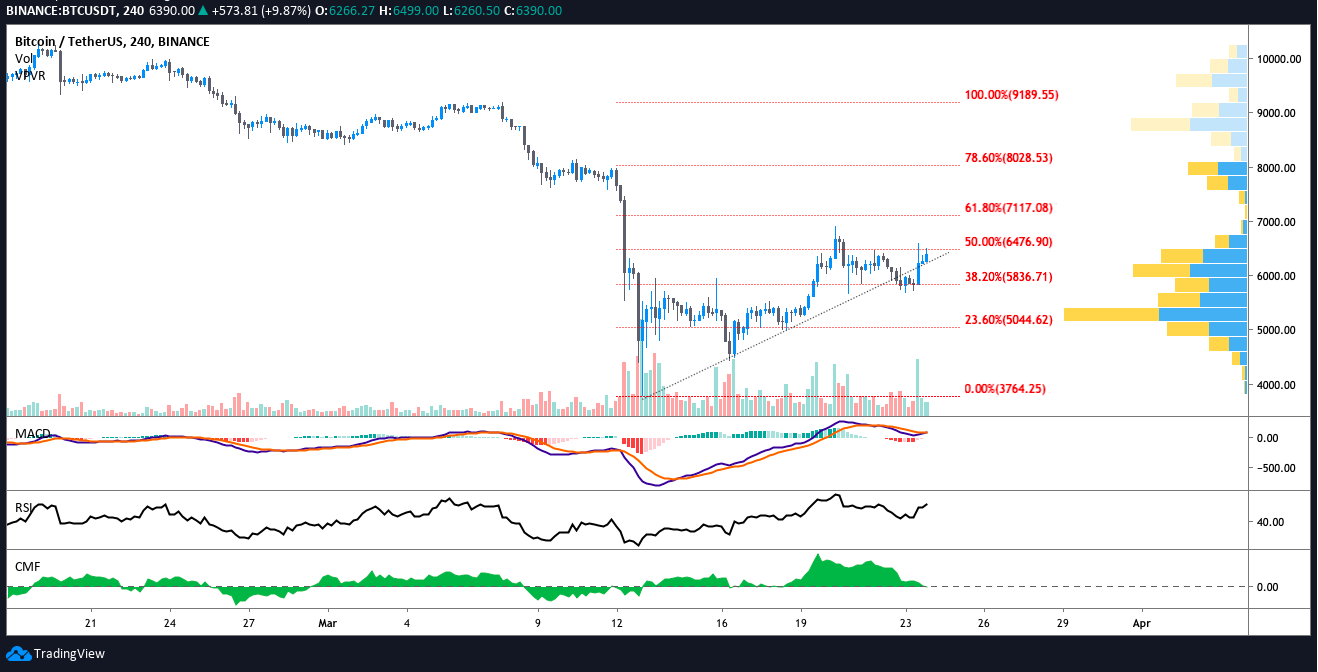
BTC USDT 4-hour chart. Source: TradingView
In the shorter time frame traders will note that the moving average convergence divergence (MACD) is in the process of converging with the signal line and the histogram is on the verge of turning positive above 0.
The relative strength index (RSI) is also climbing into bullish territory and is currently above 61. Gains above $6,455 place Bitcoin price above the 50% Fibonacci Retreacement level but the 61.8% Fib retracement is also expected to function as a level of stiff resistance.
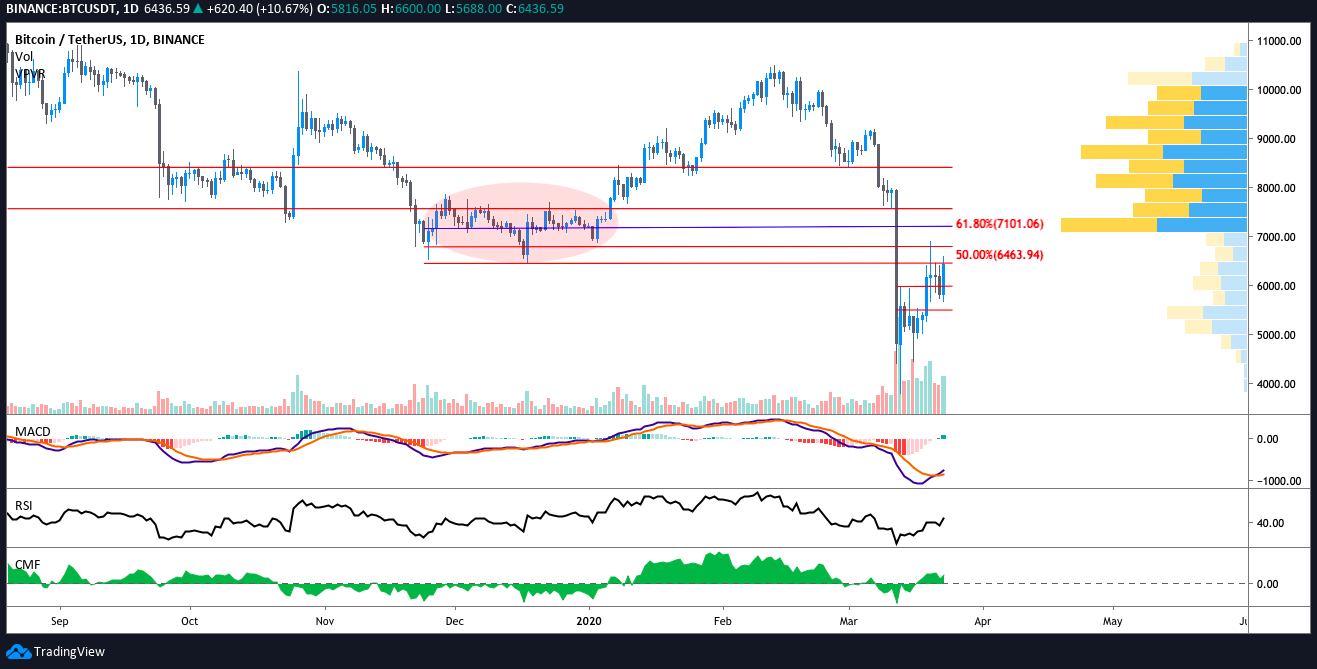
A glance a Bitcon’s price history on the daily timeframe shows that the price consistently encountered resistance at this level when below the 61.8% level and support at this retracement when trading above it.
BTC USDT daily chart. Source: TradingView
Notice that the March 20 rejection at $6,900 is within a hair’s reach of the 61.8% Fibonacci retracement level at $7,101. From November 27, 2019 until January 3, 2020 the 61.8% Fib level had provided steady support so barring a high volume breakout, it’s likely to now function as resistance. The volume profile visible range also shows a high volume node right at this level.
In the event of a pullback, $6,200 is the nearest underlying support and below this level $5,800 and $5,500 have proven to be reliable supports. As suggested yesterday, risk averse traders could wait for a few 4-hour candle closes above the ascending trendline or a daily close above $6,455.
Bitcoin daily price chart. Source: Coin360
Altcoins also fared well as Bitcon price found its legs today. Ether (ETH) rallied 5.06% to $131.52, Litecoin (LTC) gained 6.23% to trade at $38.25, and Tezos (XTZ) added 8.05% and currently trades at 8.05%.
The overall cryptocurrency market cap now stands at $181.9 billion and Bitcoin’s dominance rate is 64%.


