Bitcoin Prices Turbulent As Exhausted Indicators Drift In A Volatile Distribution Area
May 11, 2020 by Ramiro Burgos
Bitcoin Prices are taking a wild ride during the run up to the bitcoin mining reward halving. Along with major world shakeups due to Covid-19 keeping the cryptocurrency markets in flux.
Also Read: Bitcoin Prices Immerse In a Volatile Zig-zag Lateral Action Could Head Down to Bounce at $3300
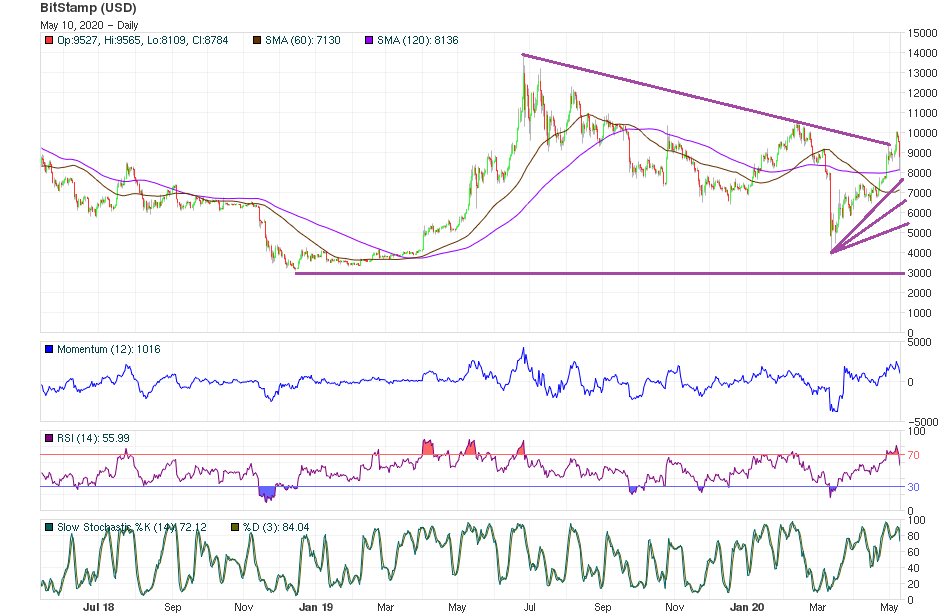
Long-term Analysis
A distribution area between $10000 and $7000 could oversell the market before sending values down to $5000. Quotes could be covering a wide range up and down with plenty of volatility levels at least for another three weeks. Before a breakout of it, perhaps to the downside, but now the leading indicators seem to be exhausted.
Following the Mass Psychology´s phases and development of the Disbelief phase is on due to the weakness of the uptrend. A distribution area is increasing by the offer and demand is missing, to drive the breakout idea down to next support near $5000 or below. External factors and News stopped bringing a base to a natural integration of Bitcoin into global portfolios as an accepted asset. possibly in the mid-term future, and values would go lateral from now to June.
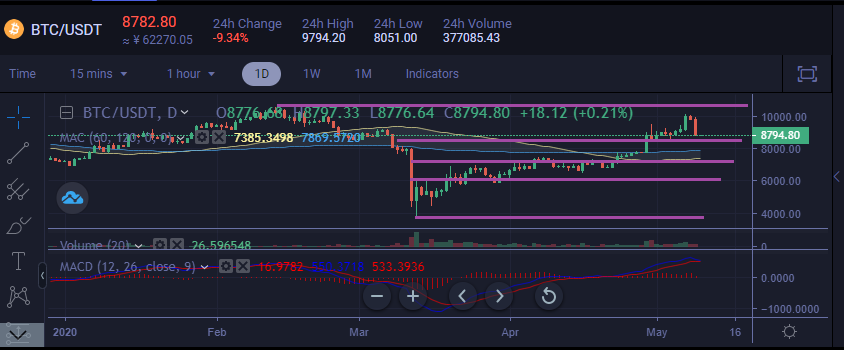
Mid-term Analysis
A partial reversal movement took place as expected as a kind of confirmation to activate the current new $3000 basis points scenario. Positive political factors from traditional mass media and promises for the future could attract the public. To be able to receive the massive selling distribution from Smart Money and Institutional Investors precisely at this level.
Measurable indicators can´t sustain any idea of a further bullish development. Now, they do not work as a sustaining net anymore, while traditional formations reflect the market weakness.
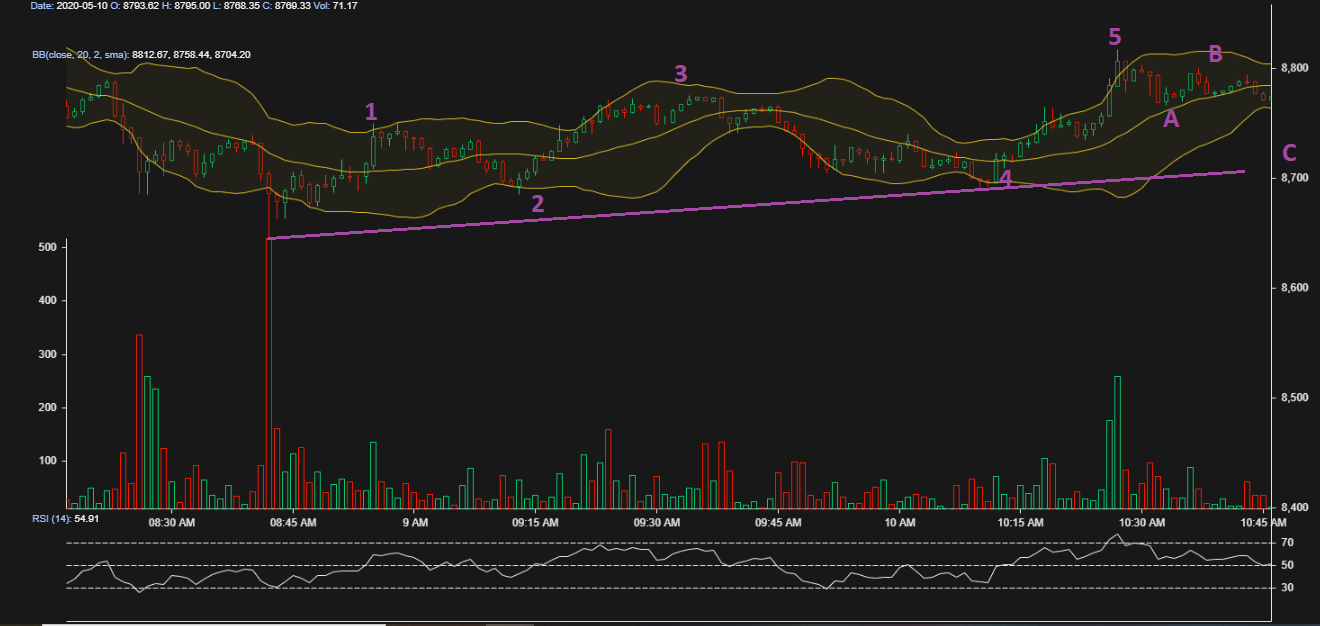
Japanese Candlestick evaluation at current sustaining sideways movements, favor the supply and a bearish definition. Using Elliot Wave Theory, a bearish trend is possible in the near term, heading quotes down to $5300.
Even volatility provides some isolated peaks near $10000, and the trend seems to be going down. According to Fibonacci Fan lines, the next stage could be a mid-level sustaining area, arising plenty of volatility could recognize an intermediate level at $5000 as a probable Dead Cat Bounce. After halving, demand´ soldiers should reorder themselves. To clash against the crows with a chance to prevail in a reversal scenario from June.
What do you think will happen to the bitcoin price? Share your predictions in the comments below.
If you find Ramiro’s analyses interesting or helpful, you can find out more about how he comes to his conclusions by checking out his primer book. The Manual de Análisis Técnico Aplicado a los Mercados Bursátiles.
The text covers the whole range of technical analysis concepts, from introductory to advanced and everything in between. To order, send an email to [email protected]

Images via Pixabay, Ramiro Burgos
This technical analysis is meant for informational purposes only. Bitsonline is not responsible for any gains or losses incurred while trading bitcoin.