Bitcoin’s bulls are taking a breather, having engineered the longest run of daily gains since last summer.
At press time, the number one cryptocurrency by market capitalization is trading in a sideways manner around $7,730 on major exchanges, representing a 0.60 percent decline on the day, according to CoinDesk’s Bitcoin Price Index.
The lackluster trading comes a day after prices hit a 6.5-week high of $7,800. Notably, the cryptocurrency has eked out modest gains in each of the last seven days. Bitcoin last rallied for seven straight days in July 2019.
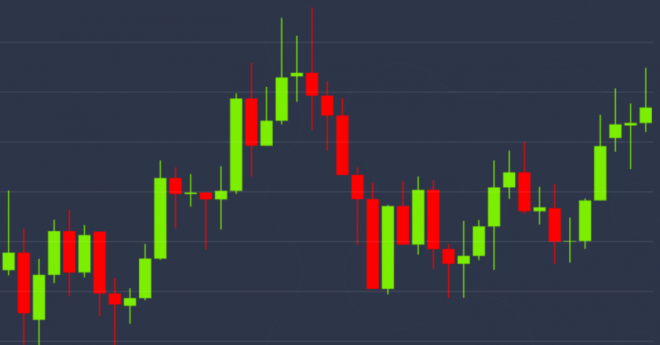
The seven-day winning trend (above right) from July 30 to Aug. 5, 2019, saw prices rise by over $2,600 to highs near $12,000. While the upward move was bigger than the latest $1,000 rise from $6,800 to $7,800, it was short-lived and reversed in the following 10 days.
Meanwhile, most analysts are anticipating an extension of the recent uptrend, possibly to $10,000, in the days leading up to the mining reward halving, due on May 12.
See also: Bitcoin Halving, Explained
Some observers, however, think the cryptocurrency could witness a pullback before breaking above $8,000 in a convincing manner.
“Feels like we have gone quite far over the last week and now there’s every chance of a small pullback (perhaps as far as to $7,000) over the course of the next few days,” Chris Thomas, head of digital assets at Swissquote Bank, told CoinDesk.
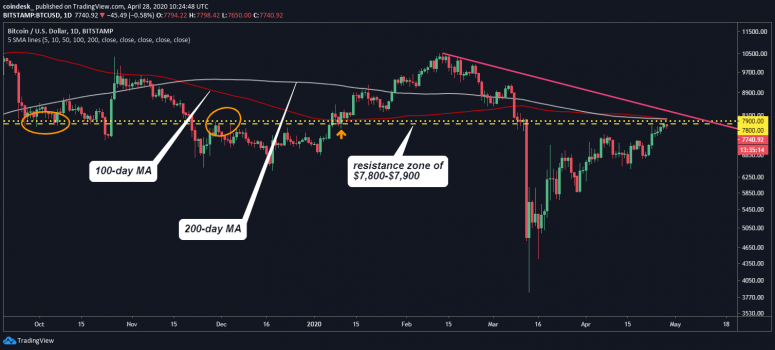
To make $8,000 a tough task, bitcoin is also approaching a cluster of resistance levels lined up in the $7,800 to $8,000 range.
Daily chart

To start with, the $7,800-$7,900 area has offered strong support and resistance over the last year. “Technically its quite a large resistance for bitcoin to break,” said Jones.
Further,
the 200- and 100-day averages are lined up at $7,978 and $7,973, respectively.
If these levels prove a tough nut to crack, the market may test dip demand, or buyers’ resolve to keep the upward trend on track, by revisiting support at $7,469 (April 7 high) and $7,300 (April 18 high).
Alternatively,
a high-volume move above $8,000 would shift the focus to the resistance of the
trendline connecting Feb. 13 and Feb. 18 highs at $8,275.
The odds of bitcoin rising to $10,000 ahead of halving, as suggested by Jehan Chu, co-founder at Hong Kong-based blockchain investment and trading firm Kenetic on Monday, would strengthen if the descending trendline resistance is breached.
4-hour chart

The 4-hour chart is reporting conflicting signals.
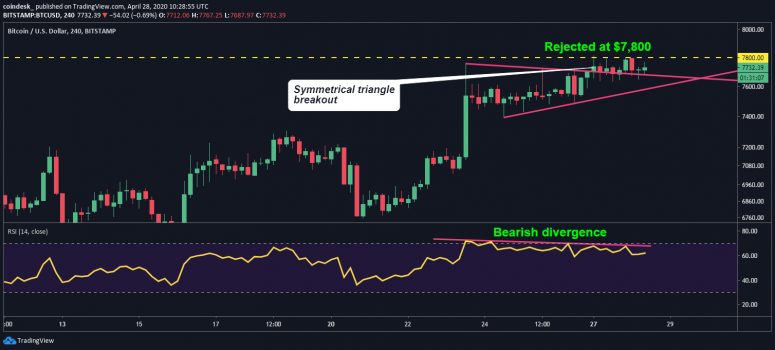
While the bearish divergence of the relative strength index (RSI) indicates scope for a price pullback, the symmetrical triangle breakout confirmed on Monday suggests the path of least resistance is to the higher side.
Price patterns usually take precedence over indicators. However, in this case, the odds of a pullback, as suggested by the RSI, look strong, as the cryptocurrency has already failed twice to chew through resistance at $7,800.
Disclosure: The author holds no cryptocurrency at the time of writing.
Disclosure Read More
The leader in blockchain news, CoinDesk is a media outlet that strives for the highest journalistic standards and abides by a strict set of editorial policies. CoinDesk is an independent operating subsidiary of Digital Currency Group, which invests in cryptocurrencies and blockchain startups.


