
Bitcoin (BTC) returned to $20,000 on Sept. 2 amid renewed bets on a “short squeeze” higher.
Trader eyes $20,700 short squeeze trigger
Data from Cointelegraph Markets Pro and TradingView showed BTC/USD recovering from another dip below the $20,000 mark on the day, continuing rangebound behavior.
The pair gave little insight into which direction the next breakout could be, with opinions differing on the surrounding environment.
Amid downside pressure on risk assets and a strong United States dollar, overall consensus appeared to favor long-term weakness continuing.
For popular trader Il Capo of Crypto, however, there was still reason to believe that a relief bounce could enter first. Thanks to the majority of the market expecting immediate losses to continue, a “squeeze” of short positions could hit, pushing spot price out of its multi-day trading range to target as much as $23,000.
“Main bearish TL broken. Bullish confirmation for the short squeeze would be a break of the 20700-20800 resistance. After this, we should see 22500-23000,” he told Twitter followers on the day:
“Invalidation for the short squeeze idea: break 19500 and main confirmation would be a clean break of 19000.”
Bitcoin circled $20,100 at the time of writing, still requiring effort to enter the launch zone for the short squeeze.
On the dollar, other crypto sources argued that the status quo was not yet showing signs of fundamental change. The U.S. Dollar Index (DXY) hit fresh twenty-year highs on Sept. 1.
People keep tryna call the $DXY top and the #BTC bottom without any reason for it
I think it’s gonna be pretty clear when it happens
For now we’re just getting continuation up on the $DXY and #BTC is sustaining low levels
There’s no reason to believe a trend shift is happening
— Kevin Svenson (@KevinSvenson_) September 1, 2022
“This will end in capitulation of the the global markets and a blow off top of the USD at some point,” analyst Matthew Hyland added:
“We aren’t there yet.”
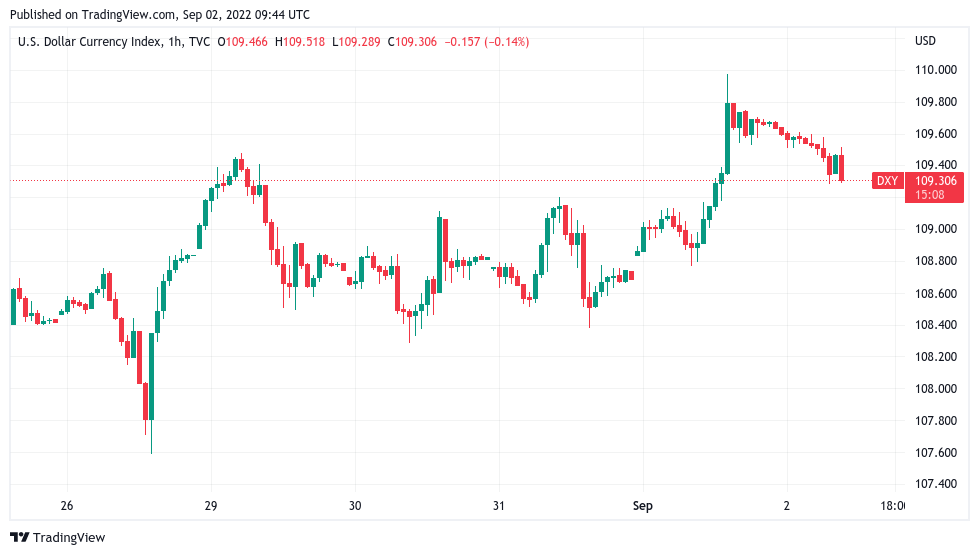
DXY was consolidating at around 109.3 at the time of writing, having hit 109.97.
Crypto market cap offers bear market hope
Offering a more optimistic take, meanwhile, was Michaël van de Poppe, founder of training firm Eight Global.
Related: The total crypto market cap continues to crumble as the dollar index hits a 20 year high
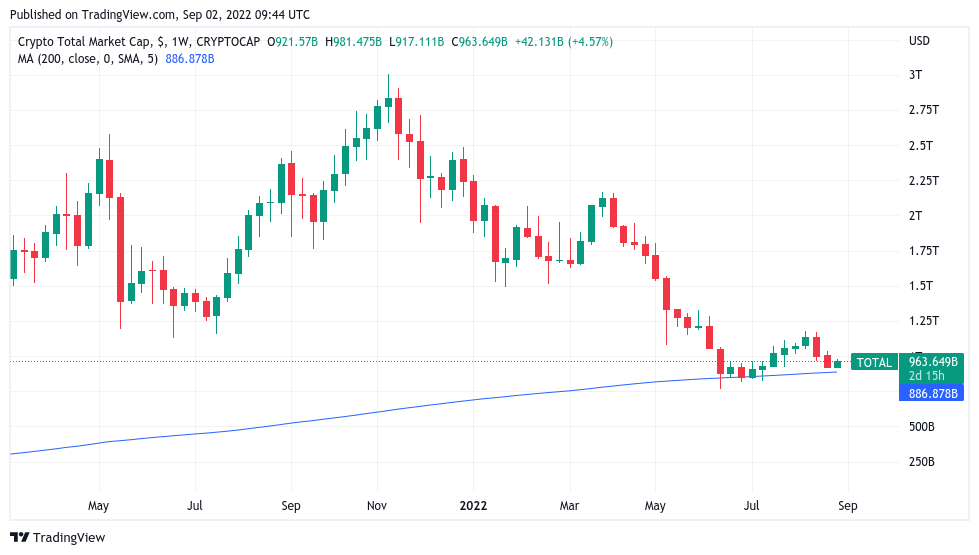
In his latest YouTube update on the day, Van de Poppe told market participants to pay less attention to the Bitcoin chart and instead focus on the overall cryptocurrency market cap.
With BTC/USD acting below the 200-week moving average (MA) for an extended period — a first in Bitcoin history — it was “not unwarranted” for sentiment to favor further losses.
“More importantly, watching the total market cap chart makes more sense, as that one grants more information on this,” he explained:
“The total market cap is showing support is around the corner, as this one kept the 200 MA as support and rested on the previous all-time high too.”
Van de Poppe thus forecasted a potential retest of the 200 MA, whereupon a clearer bottom signal would have been printed “while most of the people are anticipating a crash towards $12,000.”
The views and opinions expressed here are solely those of the author and do not necessarily reflect the views of Cointelegraph.com. Every investment and trading move involves risk, you should conduct your own research when making a decision.


