Bitcoin (BTC) remains on the defensive despite a 4-percent recovery from nine-day lows today, but bearish pressure may weaken if prices rise above key resistance near $3,900.
The world’s largest cryptocurrency by market capitalization fell to $3,629 at 05:00 UTC on Bitstamp – its lowest level since Nov. 27. At press time, the price stood at $3,770, representing a 1.5 percent drop on a 24-hour basis.
Despite the quick recovery, the odds appear to be stacked in favor of a drop to recent lows below $3,500.
To start with, BTC closed below $3,711 yesterday, invalidating the short-term bullish reversal signaled by last Wednesday’s 11 percent gains. The daily close also added credence to the bearish lower high carved out near $4,400 in the last few days.
Added to that, the bearish setup on the long duration charts suggests strong potential for a deeper sell-off.
That said, a minor recovery rally could be seen if prices cross resistance at $3,882 – upper edge of the falling wedge pattern – seen in the chart below.
Hourly chart
As seen above, BTC suffered a symmetrical triangle breakdown yesterday, signaling an end of the corrective bounce and a resumption of the sell-off.
So, the immediate outlook remains bearish as long as prices are holding below the lower edge of the symmetrical triangle pattern (former support), currently at $3,850.
BTC, however, has also established a falling wedge – a bullish reversal pattern. Therefore, the outlook as per the hourly chart would turn bullish if prices cross $3,882 (upper edge of the wedge).
The breakout, if confirmed, would open up upside toward $4,265 (Dec. 2 high) and possibly to $4,410 (Nov. 29 high).
Securing that bullish breakout, however, could prove a tough task, as the major moving averages (50-, 100- and 200-hour) are trending south in favor of the bears.
Securing that bullish breakout, however, could prove a tough task, as the major moving averages (50-, 100-, and 200-hour) are trending south in favor of the bears.
Daily chart
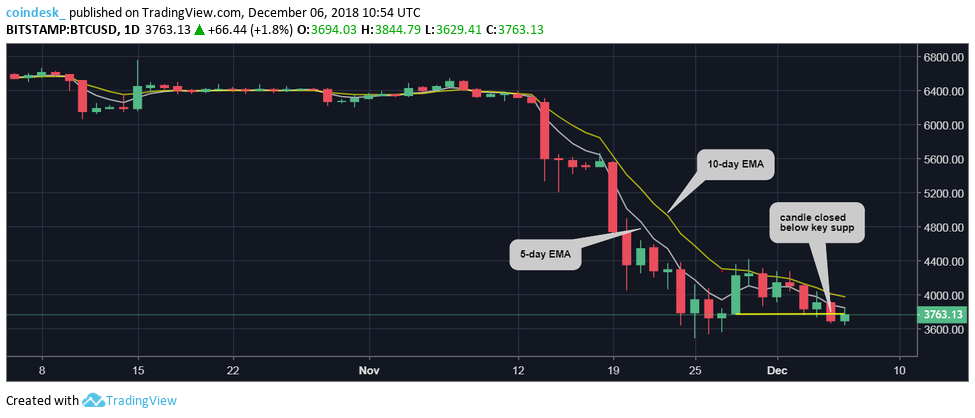
Over on the daily chart, the lower high pattern, yesterday’s bearish close below $3,771 and the downward sloping 5- and 10-day exponential moving averages (MAs) continue to favor a re-test of $3,474 (Nov. 25 low).
Notably, BTC struggled to close above the 10-day EMA during the recent corrective bounce. So, a daily close above that EMA, if and when it occurs, could be considered an advance signal of an impending bullish move.
That said, a more credible evidence of a trend reversal would be a convincing break above $4,400.
View
- The probability of a drop to the recent low of $3,474 remains high while prices are trading below resistance near $3,900.
- A break below $3,629 (daily low) will likely bring a speedy drop toward $3,474 (Nov. 25 low). A close below that would bolster the long-term bearish technicals and allow potential for a drop to psychological support at $3,000.
- A falling wedge breakout on the hourly chart, if confirmed, would open up upside toward $4,265 (Dec. 2 high), above which major resistance is seen a $4,410 (Nov. 29 high).
Disclosure: The author holds no cryptocurrency assets at the time of writing.
Bitcoin image via Shutterstock; price charts by Trading View


