Thursday’s Bitcoin (BTC) price action was relatively uneventful compared to the past 48-hours of activity that the top-rated crypto on CoinMarketCap pulled off on Tuesday and Wednesday.
On crypto-Twitter, one will easily find analysts calling for the digital asset to rally to $10,000 before halving, and a few have even hinted that a new lifetime high is on the cards.
Tether withdrawals soar with BTC price
Regardless of these predictions, Bitcoin’s $1,700 single day move made waves and crypto exchanges like Binance managed to handle $16 billion in trading volume, a new all-time high not seen since January 2018.
Data from on-chain analytics provider glassnode showed that USDT withdrawals also reached an all-time high of $1,943,417 shortly after Bitcoin price topped out at $9,450.
Crypto market daily price chart. Source: Coin360
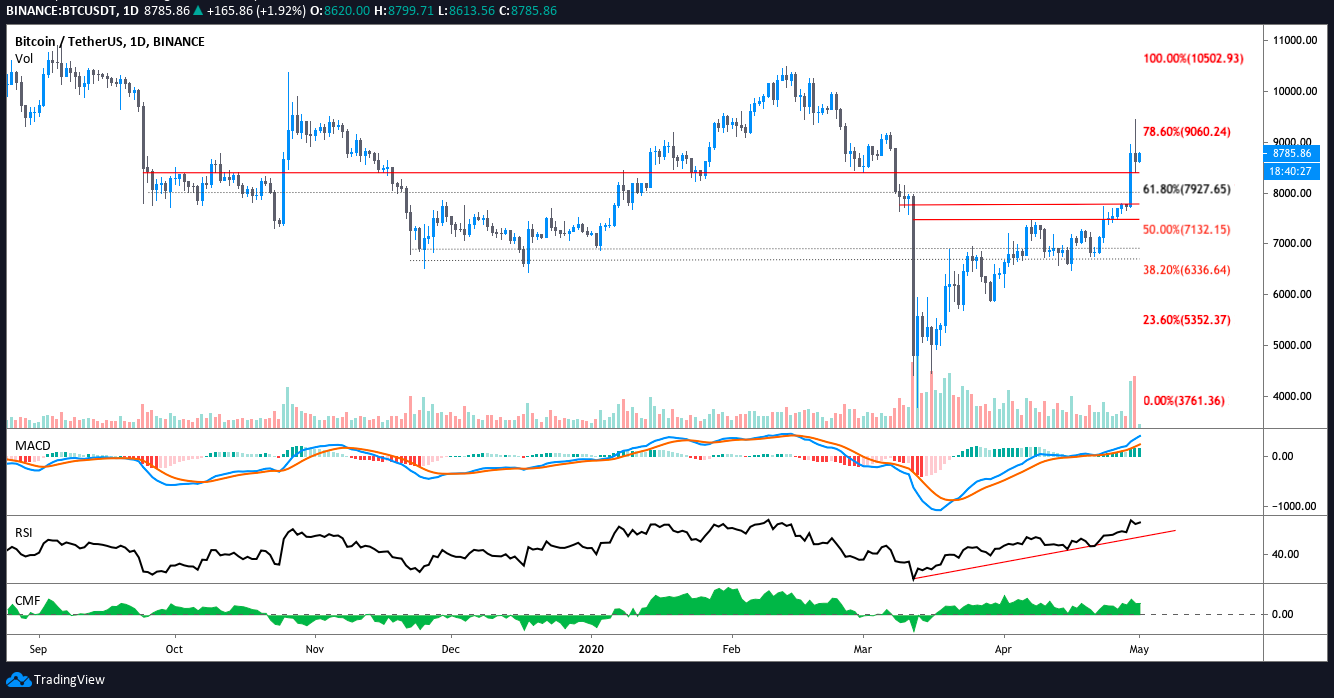
After reaching $9,450, the digital asset pulled back 11.36% to $8,394 before recovering to trade in the $8,600 range for the remainder of the day. As discussed in a previous analysis a pullback to retest former resistance levels was to be expected.
A retest of $9,000 back in play
The bounce at $8,383 also briefly touched the $8,300- $8,500 zone, which has functioned as a resistance and support since last September 2019.
BTC USDT daily chart. Source: TradingView
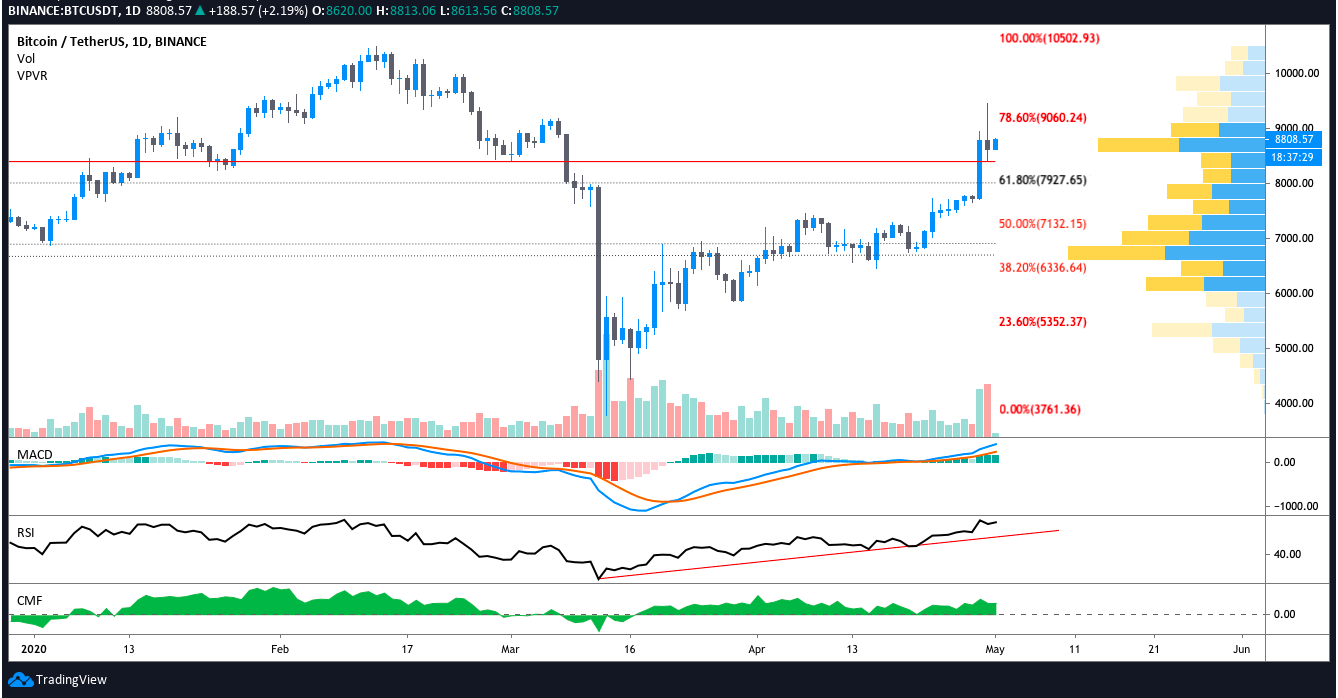
At the time of writing, BTC/USD is attempting to push above the $8,600-$8,800 zone where there is also a high volume node on the VPVR. A move above this level opens the door for a revisit to $9,200-$9,400.
BTC USDT daily chart. Source: TradingView
If Bitcoin is unable to hold at $8,600 a drop to the 61.8% Fibonacci retracement is expected but a golden pocket bounce seems unlikely since Wednesday’s daily candle swiftly cut through multiple resistance levels without building the levels of support which are usually the result of consolidation phases.
Therefore, if Bitcoin doesn’t manage a bounce off the 61.8% Fib level, a revisit to stronger supports at $7,450 and $7,600 is more likely to occur.
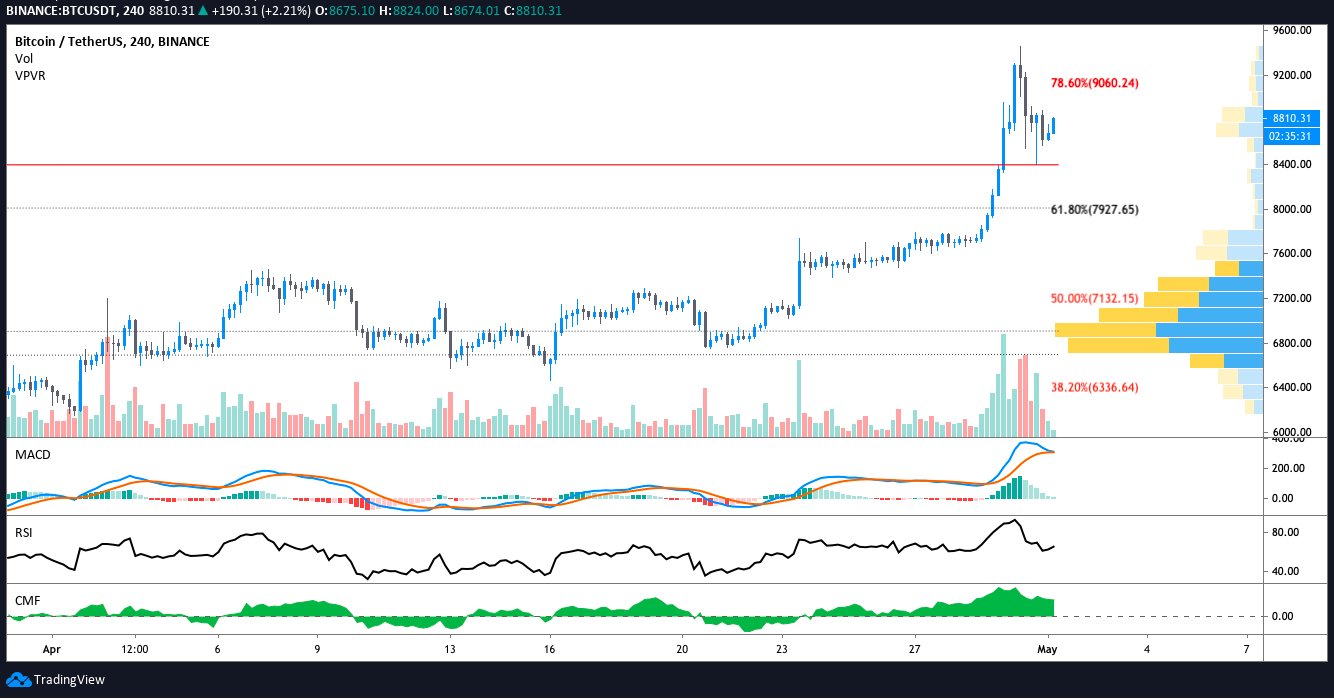
BTC USDT 4-hour chart. Source: TradingView
Currently, the price is attempting to set a 4-hour higher high above $8,876 but buying volume is just a sliver and there is a bear cross on the moving average convergence divergence. On the hourly time frame the MACD is curving up toward the signal line and the histogram is slowly working its way toward 0. The 4-hr RSI is also pushing back into bullish territory at 65.
For the time being, traders should keep an eye on the 1-hour timeframe to watch for an increase in buy volume and 1 or 4-hr candle close above $8,876.
The views and opinions expressed here are solely those of the author and do not necessarily reflect the views of Cointelegraph. Every investment and trading move involves risk. You should conduct your own research when making a decision.


