With all eyes on the crypto market mayhem and Bitcoin’s new year-to-date lows, the cryptocurrency’s soaring volatility levels remain under reported. According to the Bitcoin (BTC) Volatility Index as of yesterday, Dec. 9, volatility levels on the BTC-USD market have risen three-fold on the month.
BTC-USD Volatility Index 30-Day Chart, Nov. 9 – Dec. 9. Source: buybitcoinworldwide
The most recent available data for Dec. 9 indicates that BTC-USD volatility hit 5.53 percent, as compared with 1.57 percent on Nov. 9 at the start of the 30-day Volatility Index. As of Nov. 19, volatility has been on a consistent ascent, from 2 percent to 4.53 percent one week later, and then upwards to break above 5 percent on Nov. 29.
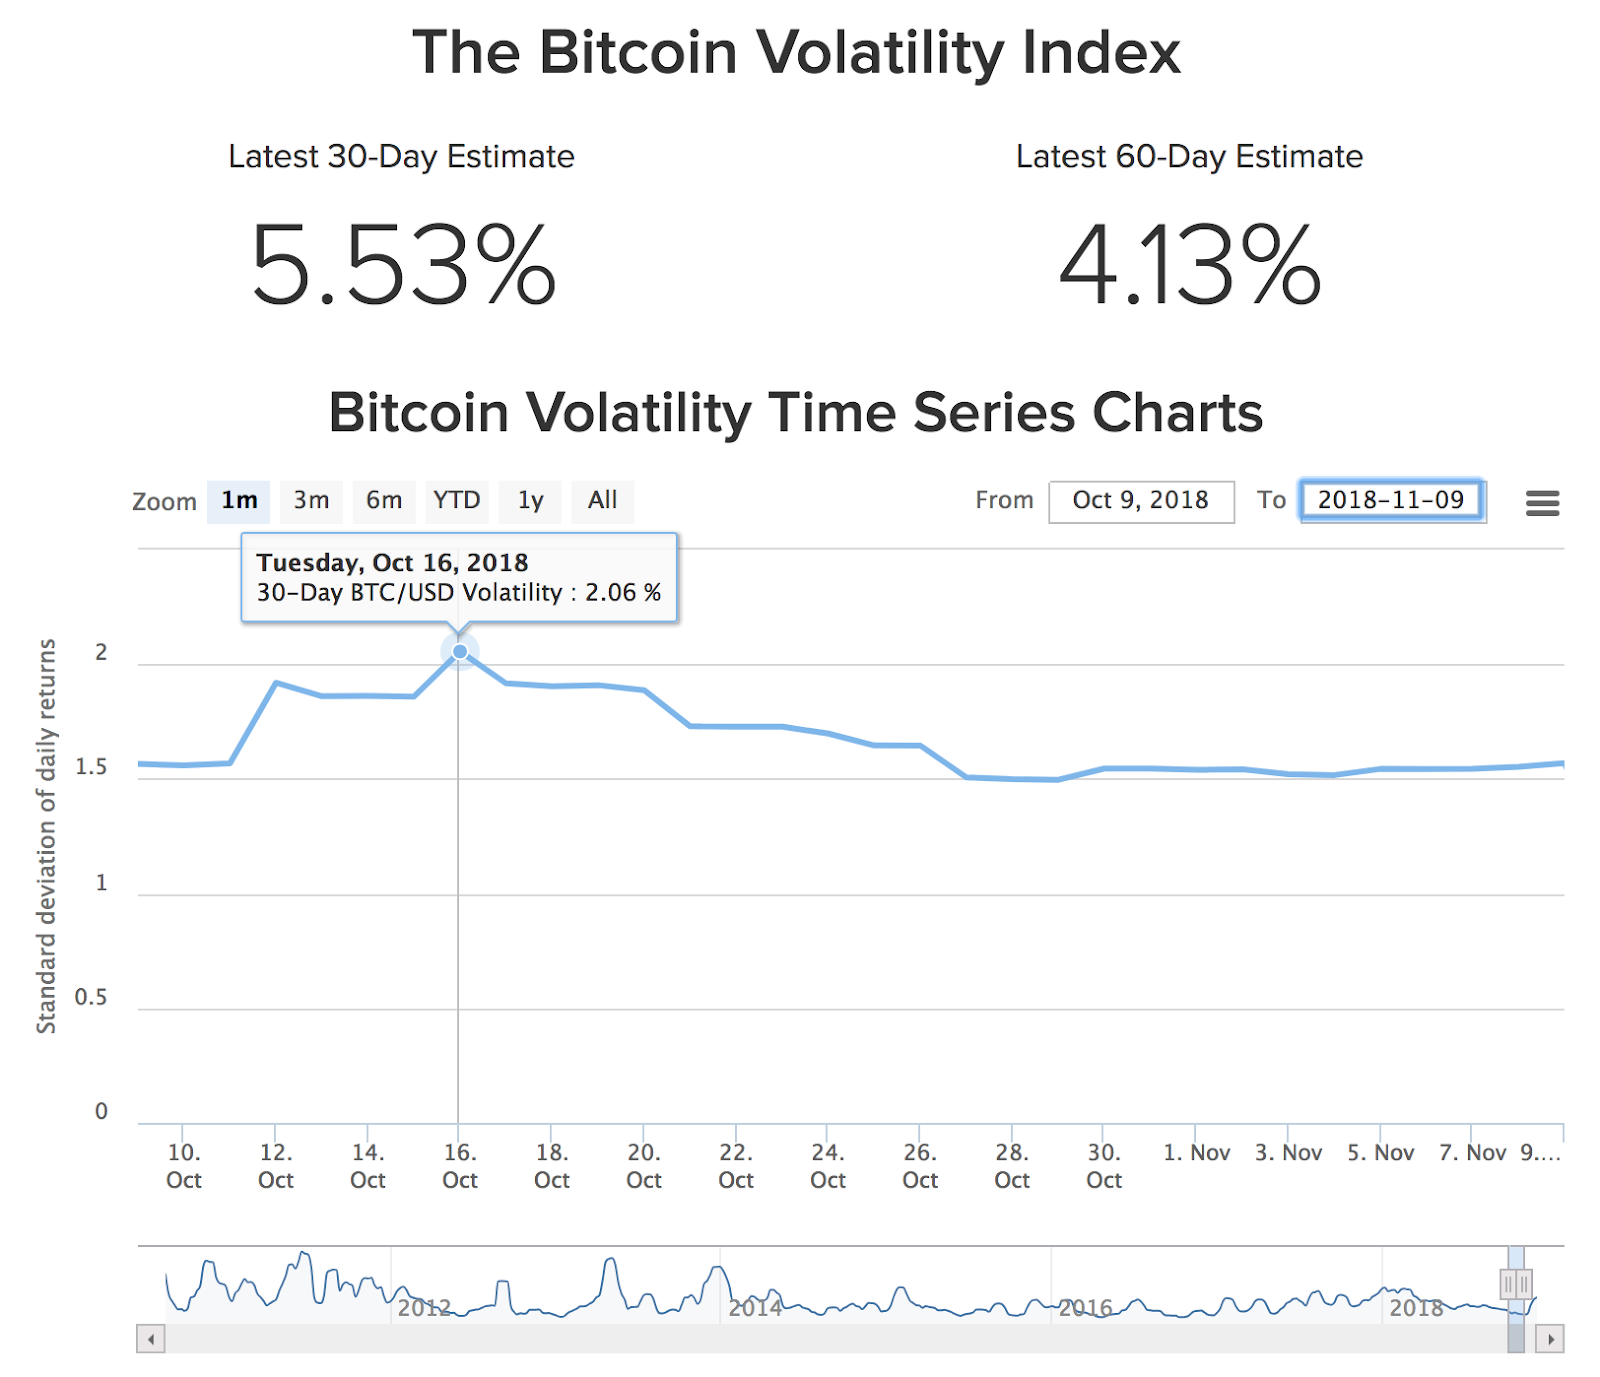
According to the BTC-USD chart for the preceding 30 days — between Oct. 9 and Nov. 9 — volatility did not rise above 2.06 percent at any point, remaining closer to 1.5-1.7 percent for the majority of the period.
BTC-USD Volatility Index 30-Day Chart, Oct. 9 – Nov. 9. Source: buybitcoinworldwide
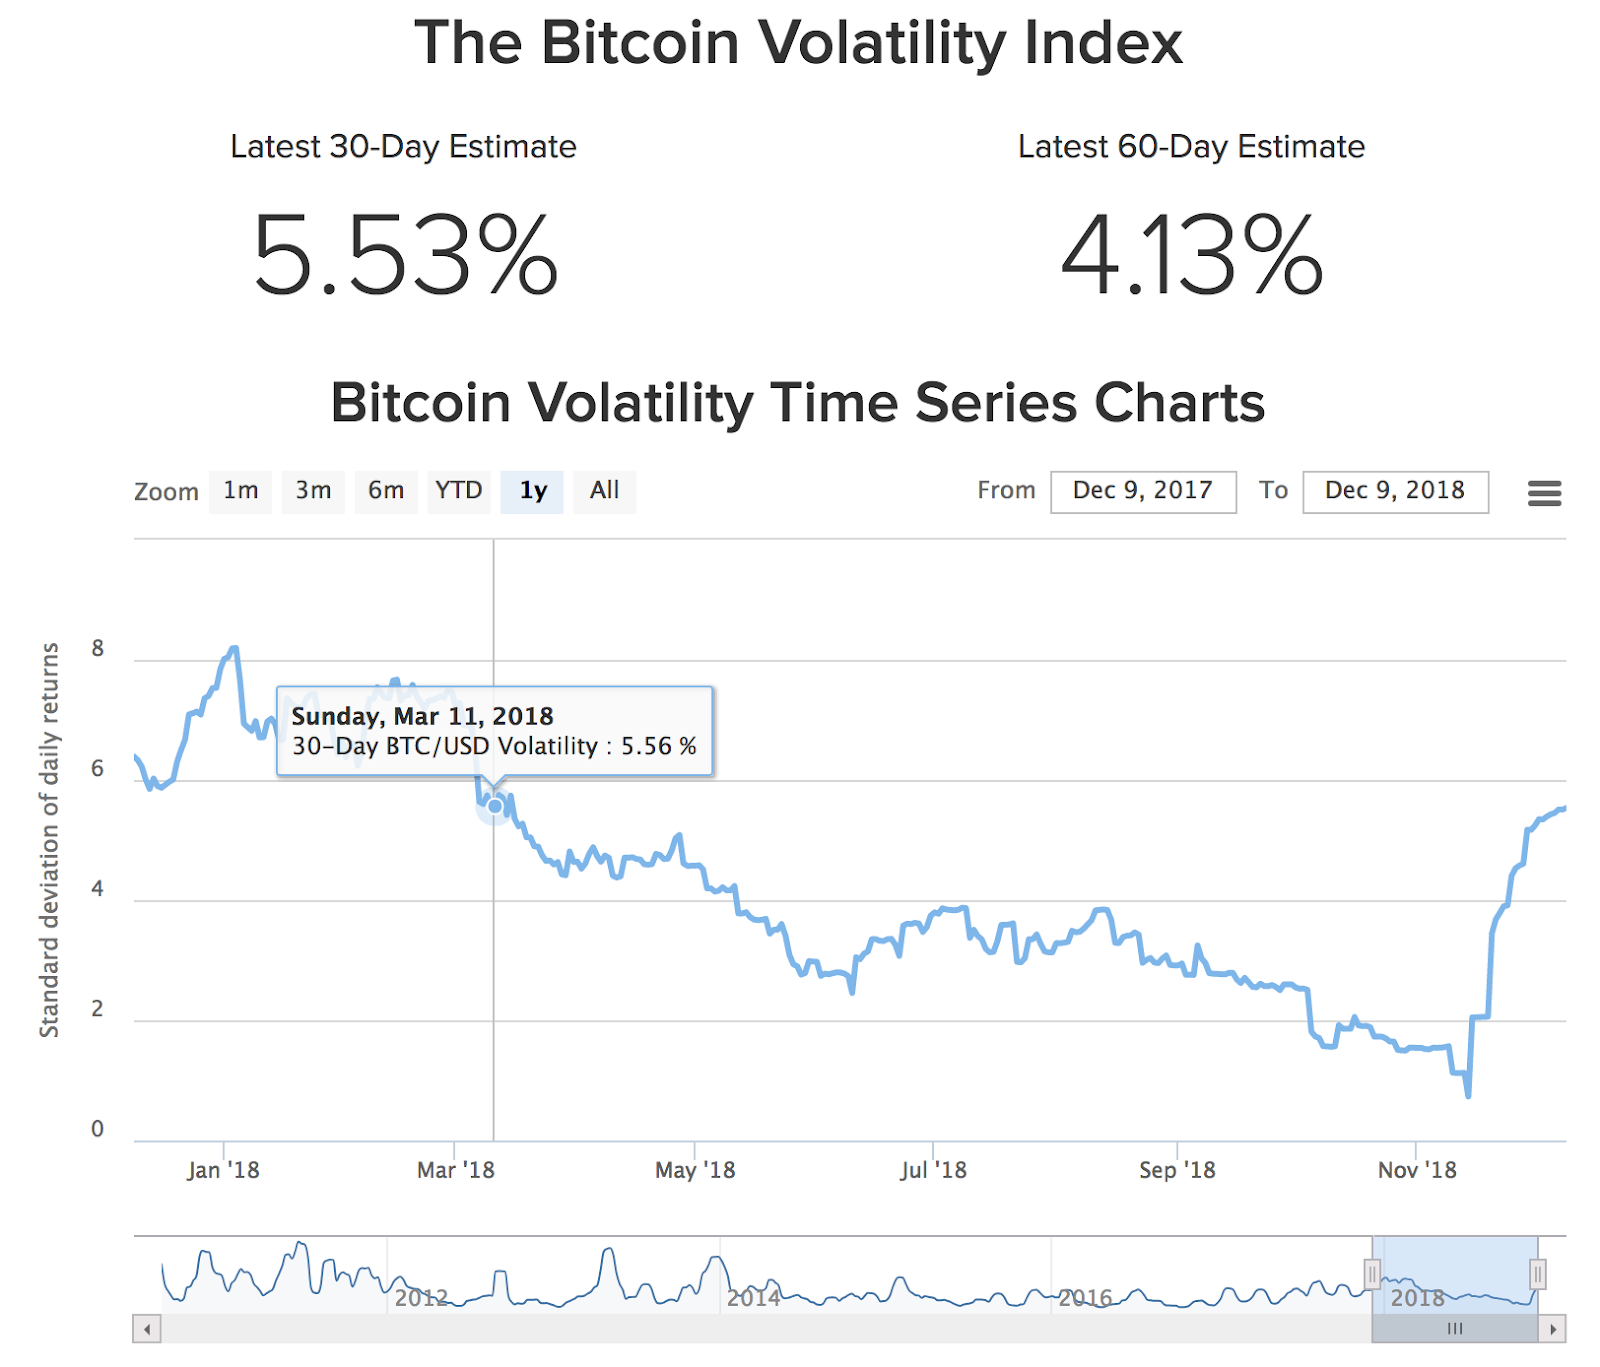
On the BTC-USD 6-month volatility chart, the trend shows a jagged but consistent decrease in volatility as of mid-August — from a six-month high of 3.84 percent in mid-August down to a low of just 0.73 percent in mid-November — before the exponential rise in recent weeks.
BTC-USD Volatility Index 1-year Chart, Dec. 9 2017 – Dec. 9 2018. Source: buybitcoinworldwide
The last time volatility was at a similar level this year was in mid-March, when Bitcoin was trading around $8,771 (Mar. 11), according to CoinMarketCap historical data.
As previously reported, Bitcoin achieved a 17-month low volatility rate in early October, drawing considerable attention from the crypto community, and even the short-lived joke the asset had transpired to become “the ultimate stablecoin.”
As of press time, Bitcoin is trading at $3,524, up 1.5 percent on the day and down around 16 and 45 percent on the week and month respectively, according to Cointelegraph’s Bitcoin Price Index.


