Evidence is emerging that bitcoin has yet to truly earn its reputation as an “uncorreleated asset.”
Case and point, bitcoin’s latest sell-off from $6,000 to nearly $3,000 was accompanied by a surge in the CBOE Volatility Index (VIX). The VIX measures the 30-day forward-looking volatility of the S&P 500 to gauge the market’s fear and risk tolerance, which is why it is commonly referred to as the “fear gauge” for the broader U.S. stock market.
In theory, the VIX should be low when the S&P 500 is in a steady uptrend and should only rise as does fear, causing panic selling and for either smart or weak hands to be shaken out of the market.
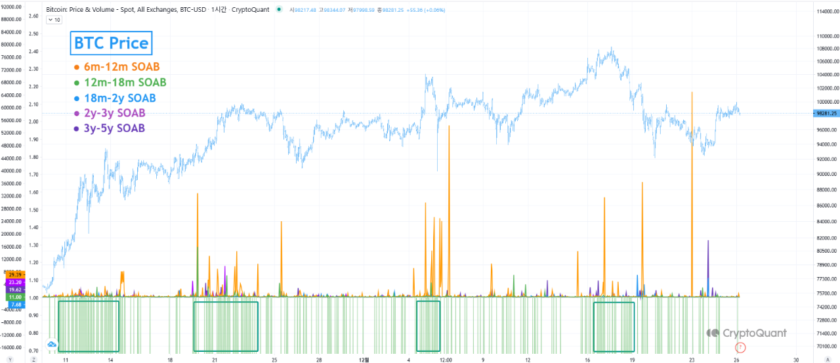
Bitcoin, being a store of value that isn’t the product of a government, is advertised to be unaffected by the perceived fear or risk in any market, yet as the chart below shows, that is not yet the case.
BTC/USD vs. VIX
The VIX printed two significant peaks in 2018. The first occurred on Feb. 6 when it reached 50.3 and the second on Dec. 24 when it reached 36.1.
At the first peak, the S&P 500 was down nearly 10 percent from its January highs and on the second peak it was down closer to 20 percent from the record highs achieved just two months prior.
Needless to say, fear was, and still is, prevalent in the broader U.S. Stock market, which should have resulted in either a stable or bullish bitcoin, right?
Wrong. Bitcoin inversely correlated with the VIX on both occasions. When the VIX reached its first peak, bitcoin had just finished falling 70 percent from its January highs and during the second peak, its price had just declined another 50 percent.
Bitcoin’s negative correlation with the VIX shows it performs poorly when fear in the U.S. equities market creates a “risk-off” environment – by definition, the opposite of a safe haven asset.
Gold vs. Bitcoin
For reference, the globally recognized safe haven asset, gold, positively correlated with the VIX during its two major peaks in 2018.
During the VIX’s February high, gold (US$/OZ) largely traded sideways between $1,300-$1,370 and only began to fall toward $1,160 in May as the VIX sank and the S&P 500 regained strength.
Gold, again, correlated with the VIX during its December peak. As equities began crashing and fears of a global economic recession circulated, the shiny metal had already been in a 20 week long and more than 10 percent uptrend.
Indeed, the physical physical store of value is still earning its name as a safe haven asset while the digital alternative has yet to be able to.
Disclosure: The author holds BTC, AST, REQ, OMG, FUEL, 1st and AMP at the time of writing.
bull bear reflection via Shutterstock


