Bitcoin’s price emerged above three major moving averages for the first time in nearly 15 months on Tuesday.
The development is a byproduct of the cryptocurrency’s surge above $5,000 during Tuesday’s trading session, representing an increase in excess of 20 percent.
A moving average (MA), when used in financial analysis, is simply a continuously calculated average of a certain economic factor like price or trading volume over a specified period of time. The moving average is particularly useful for smoothing out short-term fluctuations in the data set to identify the direction of the longer term trend.
Certain moving average durations like the 50, 100 and 200 day MA’s are of more importance when analyzing the price of a traded asset because they tend to display if recent price action is out or under performing its recent or distant trends, which can highlight bullish or bearish market conditions. Perhaps most significant is the 200 day MA, which is commonly regarded as the dividing line between a strong market and weak one.
Notably, bitcoin’s price is now trading above these three key moving averages in first since January 13, 2018.
BTC/USD daily chart
As can be seen in the chart above, bitcoin at the time was priced closer to $15,000 before falling below the 50 day moving average, according to Bitstamp figures. Contrary to what occurred today, this was a bearish signal that pointed to a degree of loss to the strength of the short term trend.
Not long after falling below the 50 day MA, bitcoin’s price found acceptance below the remaining two moving averages, solidifying the newfound bearish trend.
Recently, however, the opposite appears to be the case.
Bitcoin’s price began trading above both the 50 and 100 day moving averages on Feb. 18 of this year, suggesting its trend was beginning to pick up strength. Roughly three weeks later 50 day MA crossed above the 100 day MA, which is an example of a moving average trading strategy called the bullish crossover that is generally considered a buy signal.
Last but not least, bitcoin’s price was able to trade above the 200 day moving average today for the first time since it fell below the MA on March 14, 2018.
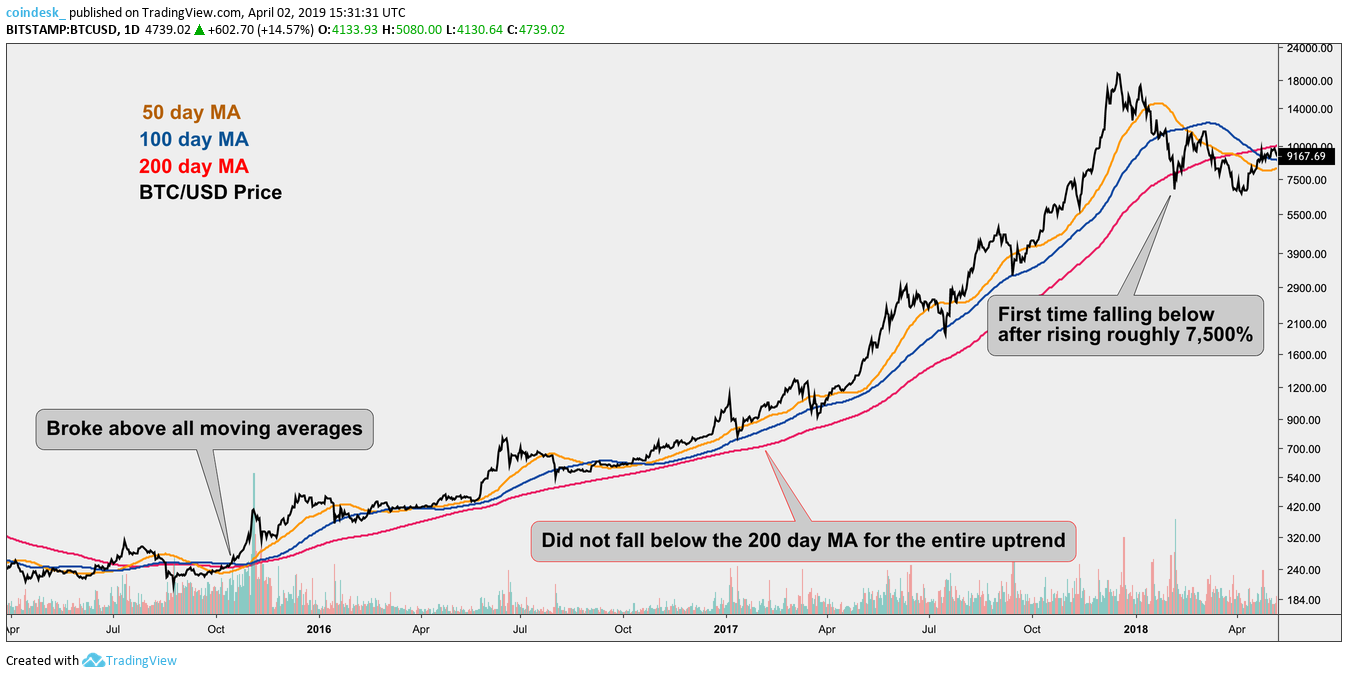
BTC/USD moving averages in 2015-2018
Looking back at bitcoin’s historical price data, the 200 day moving average indeed appears to be an important obstacle to gain acceptance above.
As can be seen, bitcoin’s price rose 7,500 percent after finding acceptance above it as well as the 50 and 100 day MAs on October 15, 2015. Notably, its price remained above the 200 day MA for the entire uptrend, until after the market had topped in early 2018.
It’s important to note major moving averages are also touted for offering price support and resistance, so the 200 day MA is likely to be a stubborn technical hurdle until bitcoin’s price can close on a UTC basis above it.
Disclosure: The author holds several cryptocurrencies, please see Sam’s author profile for more information.
Floating balloons image via Shutterstock, Charts via TradingView
Stairs image via Shutterstock


