By CCN: The long crypto winter left virtually every cryptocurrency reeling, but few assets suffered as much carnage as bitcoin cash.
The bitcoin fork endured such a brutal beating that it plunged from an all-time high of $4,000 on December 20, 2017 down to $73.60 less than one year later. The vicious downtrend pushed bitcoin cash to the brink of extinction as it lost over 98 percent of its value.
Nevertheless, the last few months have been kind to BCH. Bulls have finally returned to this beleaguered market, and they are beginning to flex their muscles. If current technical trends continue, they could stampede the bitcoin cash price all the way up to $1,200 before 2019 ends.
Bitcoin Cash Chart Flashes Undeniably Bullish Breakouts
A rising tide lifts all boats, and bitcoin’s meteoric rise last month has been beneficial to a number of large-cap cryptocurrencies. Bitcoin cash is a direct beneficiary, as it posted a number of bullish breakouts on both the shorter and longer timeframes
Shorter Timeframe Bullish Reversal
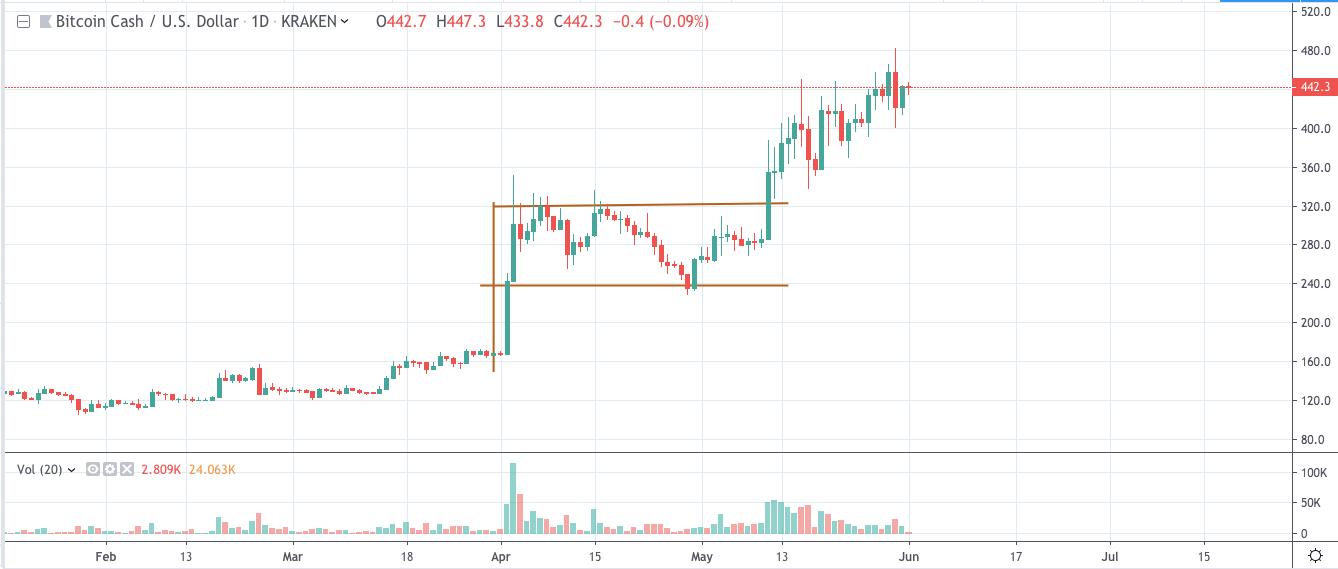
On the daily chart, we see that bitcoin cash pierced through resistance of $235 with ease. The move above this level triggered the breakout from an Adam and Eve double bottom reversal pattern. The event marked the cryptocurrency’s trend reversal on the shorter timeframe.
Bitcoin cash broke out from a double bottom reversal pattern with enormous volume. | Source: TradingView
What’s impressive about this breakout is the gigantic volume that pushed bitcoin cash above $235. On April 3, the cryptocurrency recorded 116,577 BCH in trading volume on crypto exchange Kraken. That’s over 550 percent of its average daily volume average of 17,925 BCH.
More importantly, 116,577 BCH is the cryptocurrency’s all-time volume high on Kraken. To put that into perspective, this cryptocurrency printed a little over 20,000 BCH in volume when it achieved its all-time high in price. A volume explosion of this magnitude is usually a marker of a bullish reversal.
On top of the double bottom reversal, bitcoin cash also painted a large bull flag on the daily chart. This is a continuation pattern that affirms our short-term bullish bias. The market broke out of that structure on May 11 when it took out resistance of $320. The breakout is the technical reason why bitcoin cash is trading around $440 now.

Bitcoin cash broke out of a continuation pattern after a brief consolidation period. | Source: TradingView
Longer Timeframe Bullish Reversal
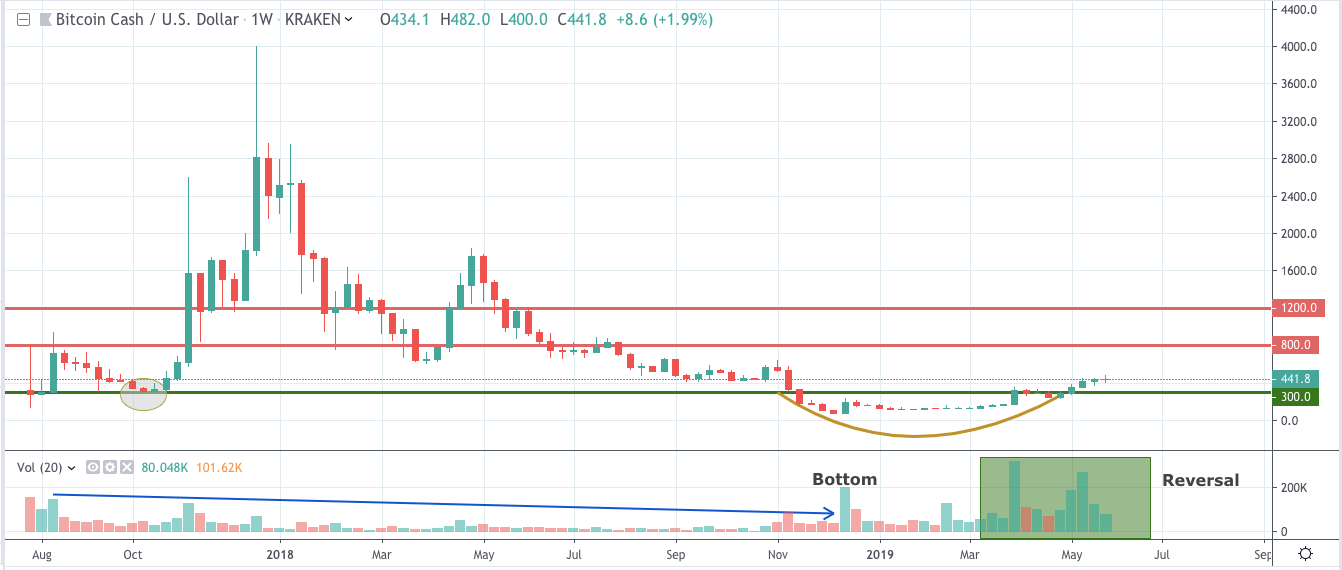
With a strong uptrend on the daily chart, bitcoin cash has also reversed its trend on the longer timeframe by breaking out of a rounding bottom pattern on the weekly chart.
Reading the cryptocurrency’s chart is so easy that you don’t have to be an expert to see that for most of the bear market, volume was anemic. Volume suddenly spiked in December 2018 to mark the bear market bottom. Several weeks later, volume surged to confirm that bitcoin cash had reversed its long-term trend.
Bitcoin Cash Buyers Are Returning in Droves
In simple terms, buyers have returned in droves. They are heavily accumulating at current levels. Why? They are spending big because they expect big returns in the future.
The conservative target for 2019 is $800; the aggressive target is $1,200. These figures are the market’s key long-term resistance levels.
With the cryptocurrency bullish on both shorter and longer timeframes, it is now a strong “buy-on-the-dips” candidate. It may go as low as $300 in the next few weeks, but we don’t expect it to fall any lower than that. Those who bought the bottom and the breakout will very likely protect their investments.
Bottom Line: BCH Offers Mammoth Upside
Bitcoin cash is the cryptocurrency market’s dark horse for 2019. As long as the coin holds above a key price level of $300, bulls remain in absolute control. Targets are $800 and $1,200. Bitcoin cash may have fallen hard, but it now looks ready to bounce back with a vengeance.
Disclaimer: This article is intended for informational purposes only and should not be taken as investment advice.


