The bitcoin price on Tuesday jumped as high as 6.1 percent against the US Dollar but failed to sustain a bullish momentum.
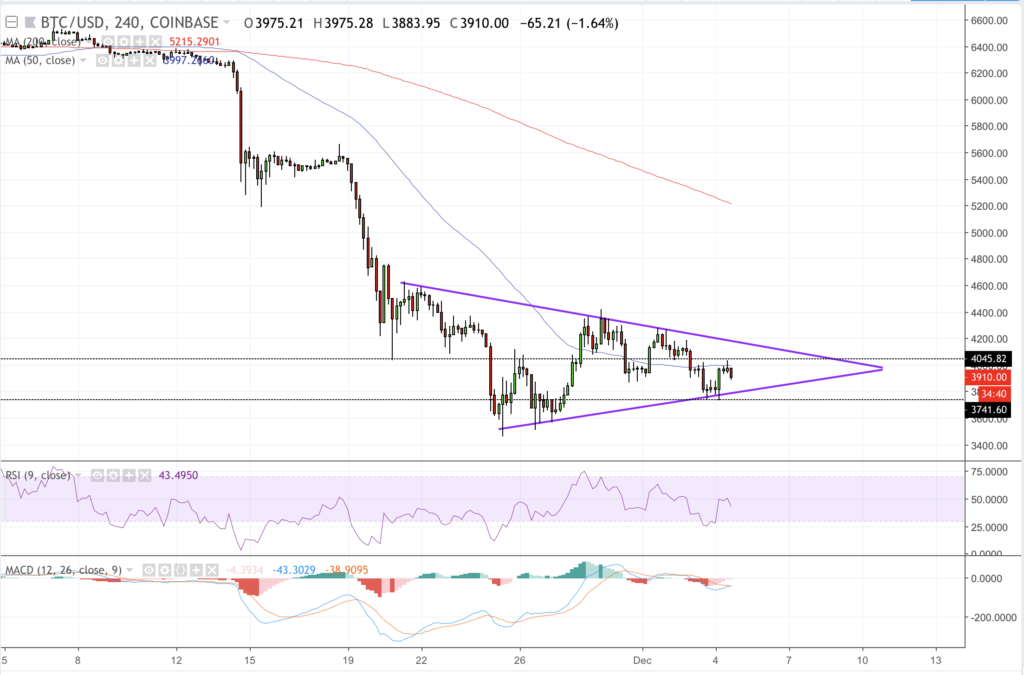
The BTC/USD index is trading at 3910-fiat at press time, up 4.5 percent from the intraday low at 3741-fiat. The pair is undergoing a pullback action after failing to sustain its run above 4000-fiat. The said level still has a lot of bearish activity going around while an equally strong buying sentiment can be seen at 3741-fiat, which has reversed downside corrections twice in the past 36 hours. It puts BTC/USD in a consolidation — a sort of bias conflict awaiting a breakout action.

The consolidation continues inside a symmetrical triangle formation – as also discussed in our previous analysis. BTC/USD is testing 4000-fiat as its psychological resistance while also eyeing the triangle resistance (falling trend line) as a potential long target. A breakout above the said levels could confirm a bullish bias in the near-term. Its longevity will be confirmed if the pair completes an inverse head and shoulder formation by testing the neckline level at 5578-fiat.
A symmetrical triangle formation also opens similar possibilities of a breakdown action. Thus, a break below the triangle support (rising trend line) could confirm a near-term bearish bias, with an interim short target waiting at 3592-fiat.
The RSI momentum indicator is showing signs of reversals, which could push it toward the selling sentiment area. The MACD indicator is also trending inside a negative territory.
Macroeconomic Factors
Meanwhile, the fundamentals are becoming stronger for bitcoin as Nasdaq has officially confirmed that will add support for bitcoin futures next year. The world’s second largest stock exchange has partnered with VanEck to roll out the said trading market. VanEck is the same company whose bitcoin ETF is being reviewed by the US Securities and Exchange Commission.
The dollar, on the other hand, is looking weaker on Tuesday as the Fed reportedly prepares to pause its interest rate hike, leading to a slippage in the US Treasury yields. The curve inversion further prompted fears of a probable recession in the market. Such fears could allow investors to pool their money into assets like bitcoin that are away from the decisions of the government or any other financial authority.
BTC/USD Intraday Positions

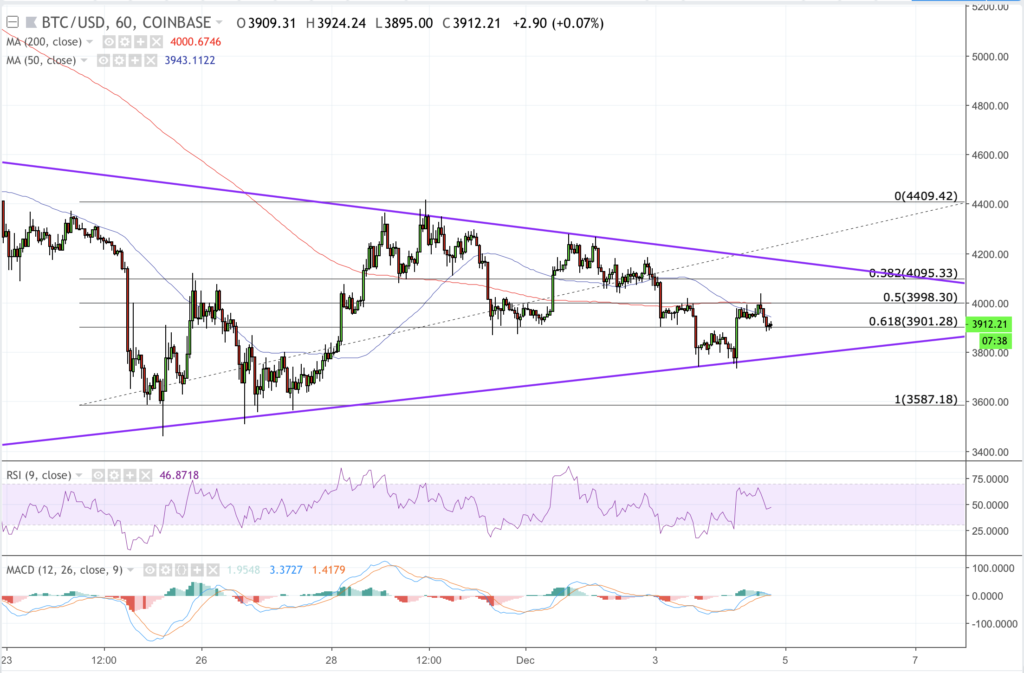
According to our intraday analysis, the bitcoin price testing 3998-fiat as its interim resistance and 3901-fiat as interim support. An ongoing bullish price action reversal at 3901-fiat is prompting us to open a long position towards 3998. As we do, we’ll put a stop loss order just $10 below the local swing low. A break above 3998-fiat, meanwhile, would have us go long after 4095-fiat, our primary upside target while maintaining a stop loss order just $5 below the level at which we entered.
The invalidation of current bullish price action would have us wait for the bitcoin price to break below interim support. As it happens, we’ll open a short trade towards the channel support depicted in purple to the downside. A stop loss order, meanwhile, will be maintained at 3911-fiat to protect our trade from potential additional losses.
Featured Image from Shutterstock. Charts from TradingView.
Get Exclusive Crypto Analysis by Professional Traders and Investors on Hacked.com. Sign up now and get the first month for free. Click here.


