Bitcoin bulls are back in charge, so to speak. The headline alone makes quite a statement, and there are no doubt several readers questioning how one might draw such conclusion after only a small move and lack of new highs.
The conclusion has been made for us all, depending on what the Average Directional Index is currently saying about an asset – in this case the top cryptocurrency by market cap. Let’s take a look what the trend strength measuring indicator says about Bitcoin price action.
Tug-Of-War Ends With Bears Falling Flat
Last week, after several weeks of chop and stalemate, Bitcoin broke out from short-term downtrend resistance, and is close to making it though high timeframe resistance as well.
The shots fired from bulls might have actually been the starting pistol ahead of the final leg of the bull run, according to the Average Directional Index.
Related Reading | Bitcoin Trend Strength Indicator Suggests Bull Run Isn’t Yet Over
In technical analysis, a reading on an indicator either is or it isn’t – meaning, for example, the MACD can only be crossed bullish or bearish, not both at the same time. The Average Directional Indicator is a trend strength measuring tool that typically comes with two built-in directional indicators – a positive and a negative.
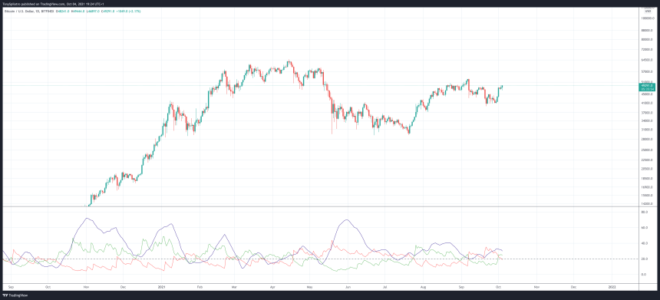
The ADX itself, simply says how strong the trend is, and the positive and negative DI tell who is in control. They make reading the tool very straightforward: green crossed above red is bullish, and red above green is bearish. From that description alone, who is currently winning the battle of Bitcoin, as pictured below?
Bulls just took over the daily trend | Source: BTCUSD on TradingView.com
Bitcoin Price Remains Bullish On High Timeframes
The green line only just took over from bears, so bulls only recently regained the upper-hand on the lowest timeframes. Bearish traders were expecting different results, because the weekly setting using this indicator is currently negatively crossed.
Related Reading | Bitcoin Ready For Display Of Strength, But Which Direction Will It Break
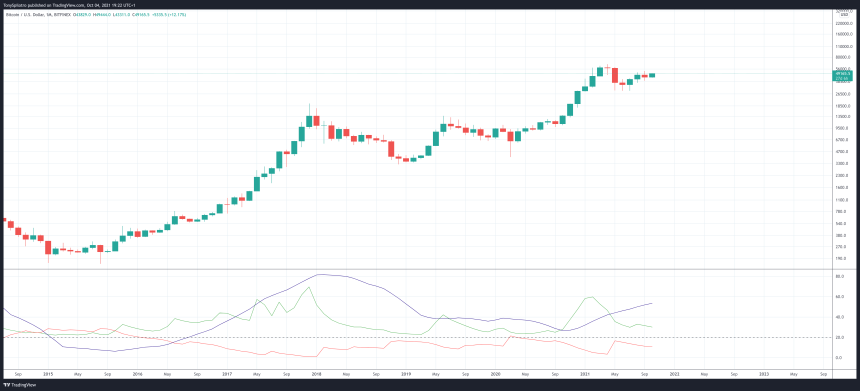
What was able to leave bears blindsided, however, was the fact that the highest timeframes still show plenty of strength left for bulls. Any recent downtrend was an attempt to feign weakness by bulls, according to the indicator’s readings.
The ADX shows plenty of bull trend left | Source: BTCUSD on TradingView.com
The ADX itself, depicted in the dark blue line, hasn’t yet begun to turn downward. When it does, it could be a sign that the bull trend is finally ending.
After the peak in 2017, Bitcoin never truly broke bearish when compared to the 2014 bear market. When bears finally do regain control over Bitcoin price, the worst bear market ever could follow.
Follow @TonySpilotroBTC on Twitter or via the TonyTradesBTC Telegram. Content is educational and should not be considered investment advice.
Featured image from iStockPhoto, Charts from TradingView.com


