Key Highlights
- ADA price declined further and traded below the $0.1620 support against the US Dollar (tethered).
- There is a crucial bearish trend line formed with resistance at $0.1680 on the hourly chart of the ADA/USD pair (data feed via Bittrex).
- The pair is under pressure and upsides will most likely be capped by the $0.1650 and $0.1680 levels.
Cardano price is under pressure against the US Dollar and Bitcoin. ADA/USD could extend declines as long as it is below the $0.1700 level.
Cardano Price Analysis
In the last analysis, we discussed that cardano price remained at a risk of more losses below $0.1600 against the US Dollar. The ADA/USD pair did move down and broke the $0.1600 support. It traded as low as $0.1560 and later recovered. However, the upside move was capped by the $0.1700 level and the 100 hourly simple moving average. The price declined once again and is currently trading near the $0.1600 level.
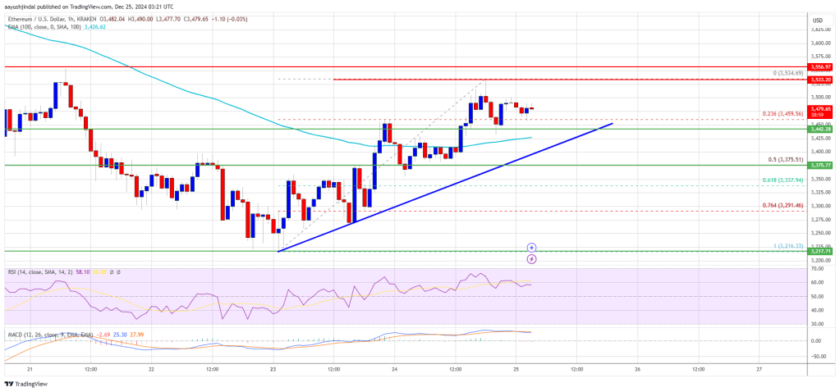
On the upside, an initial resistance is near the $0.1620 level and the 23.6% Fib retracement level of the last drop from the $0.1691 high to $0.1595 low. Above this, the next key resistance is near the $0.1650 level. It coincides with the 50% Fib retracement level of the last drop from the $0.1691 high to $0.1595 low. Moreover, there is a crucial bearish trend line formed with resistance at $0.1680 on the hourly chart of the ADA/USD pair. A successful close above the trend line and $0.1680 is needed for more gains in ADA.
The chart indicates that the price is clearly under a lot of pressure below $0.1700. If it fails to stay above the $0.1580 and $0.1560 support levels, there could be a slide towards $0.1500. Overall, buyers need to push the price above $0.1700 to avoid further declines.
Hourly MACD – The MACD for ADA/USD is placed in the bearish zone.
Hourly RSI – The RSI for ADA/USD is moving lower towards the 40 level.
Major Support Level – $0.1580
Major Resistance Level – $0.1700


