In today’s edition of Crypto Daily News, we’ll cover the details of the Chinese Central Bank launching its blockchain platform and Robinhood launching candlestick charts on its app.
Crypto Daily News: September 4th, 2018
Cryptocurrency News: Chinese Central Bank
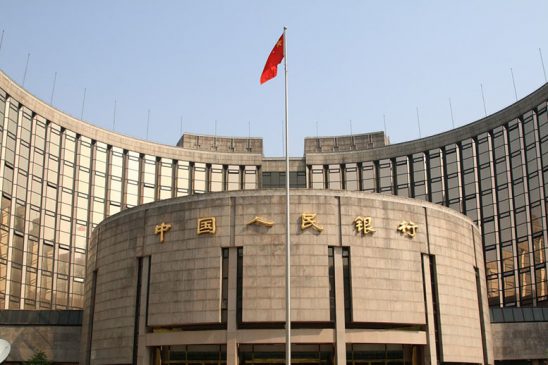
The People’s Bank of China (PBoC) has officially launched the beta testing phase of its blockchain trade finance platform, says local news outlet Shanghai Securities News. The Shanghai News source states the Shenzhen Central Sub-branch of the PBoC has entered its trial phase of the platform earlier than expected.
This finance platform is called the ‘Bay Area Trade Finance Blockchain Platform.’ This platform seeks to create an “open financial trade ecosystem based on the Guangdong, Hong Kong, and Macau Bay Area.”
The report by the Shangai Securities news states that this new blockchain-based platform will help banks conduct audits, reduce unnecessary business costs, improve efficiency, and prevent and control business risks. It will also assist regulators and strengthen the sharing of information between different departments within the bank.
The platform will also conduct trade and financing activities and provide a regulatory system for trade finance to enable real-time monitoring of various financial movements.
Cryptocurrency News: Robinhood Launches Candle Charts
Mobile trading app Robinhood has just announced that it will be rolling out Candlestick charts to “better inform” its users.
Over the past few months, we’ve been working on new features to make Robinhood even better. Introducing candlestick charts, discovery tools, and more. Take a look! https://t.co/5JpGnGnIVb
— Robinhood (@RobinhoodApp) September 4, 2018
According to the official blog post put out by the company today, over the next few weeks, Robinhood will be introducing its candlestick charts to the stock, options, and cryptocurrency pages on its mobile app.
The company also added more features to help investors make better-informed investment decisions. Robinhood is adding things such as Analyst readings, a ‘people also bought’ tab, and an About page, highlighting the company’s background and employees.
>> Abra CEO Claims SEC Will Approve Bitcoin ETF Within the Year
The new candlestick charts help investors better understand how cryptocurrency prices move. The line price only shows the close price, whereas the candlestick shows four pieces of info: the open, high, low, and close price during a certain period of time, which gives investors more information.
Check back in for more of the latest crypto news.
Featured Image: Depositphotos/© cupertino


