On Dec. 4, Bitcoin (BTC) unexpectedly rallied hard from $7,080 and over the next 5 hours the digital asset had moved 9.92% to trade for $7,788. The strong surge briefly broke the pattern of lower highs lower lows. But by the end of the day, the price had retraced back to $7,100.
Crypto market weekly performance. Source: Coin360
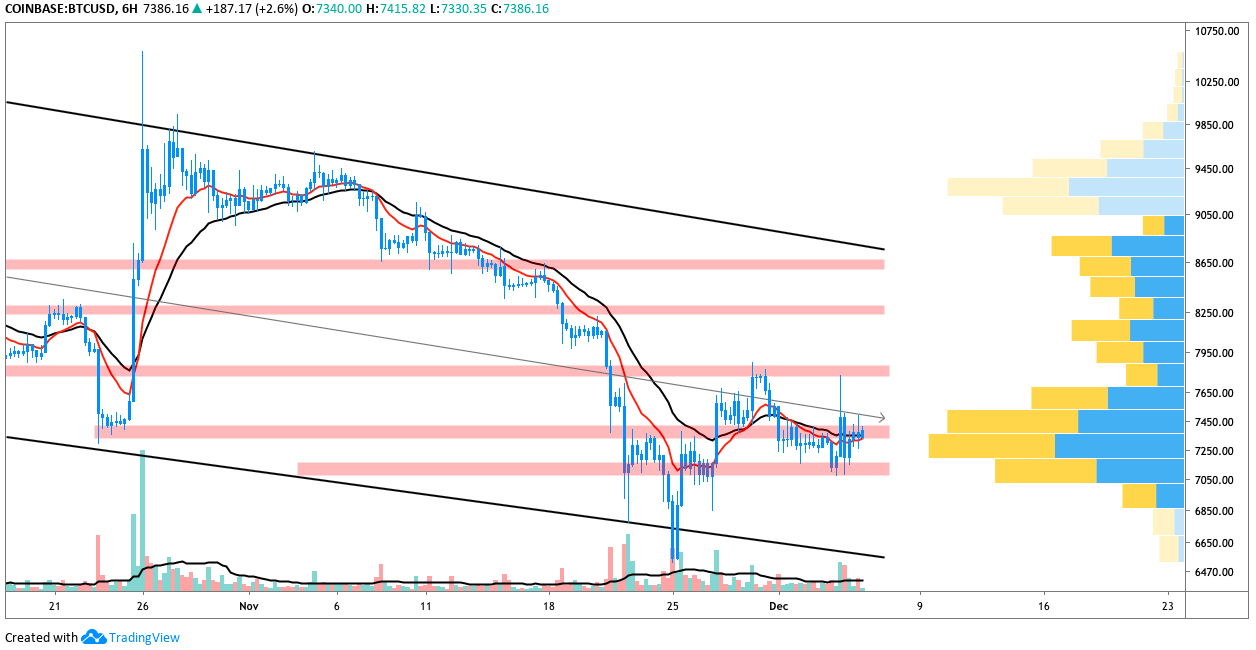
Bitcoin price slowed down as it met resistance at $7,800 and was unable to set a higher high above $8,000. Traders will note the high volume nodes of the volume profile visible range (VPVR) at $7,850 and an even larger one at $8,040. Given that the price stopped short both these nodes, the next push from bulls will need to be stronger and with sustained volume to overcome this zone.
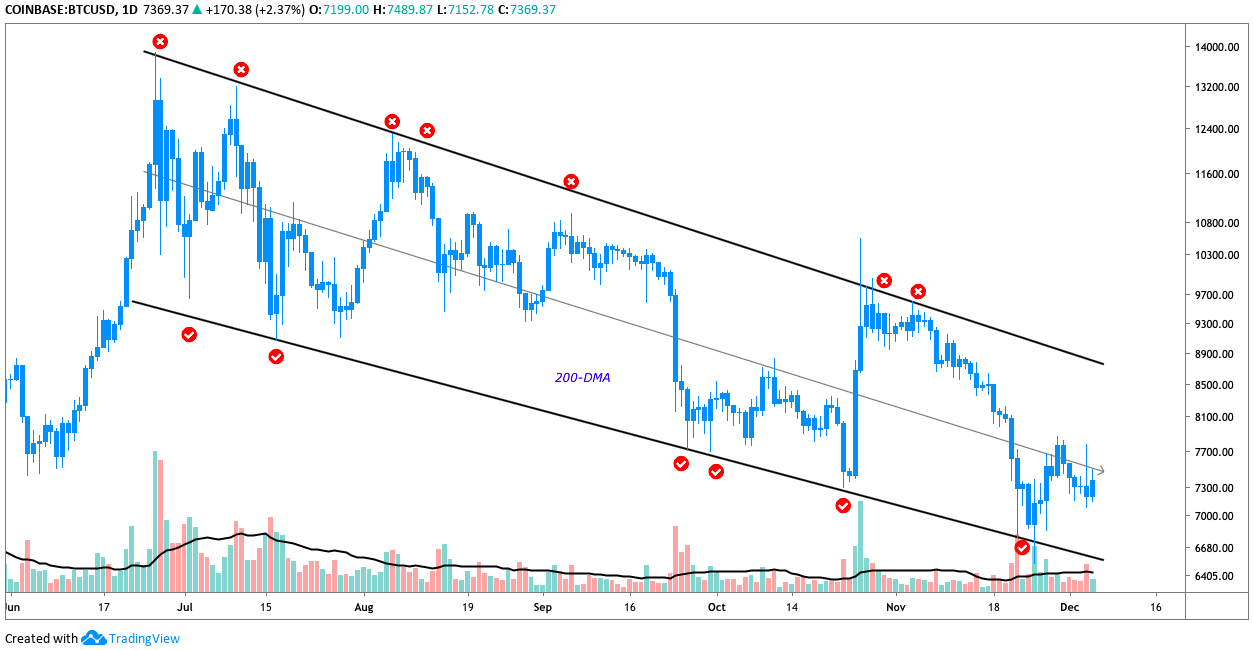
Ultimately, Bitcoin price remains trapped below the long term descending trendline and since Jun. 26 there is a clear pattern of price running up to the trendline, rejecting and falling into another phase of lower highs.
BTC USD daily chart. Source: TradingView
The situation has been less than ideal for perma-bulls who are lured into each large price drop under the belief that either a bottom has been found or the most recent drop presents an opportunity to open a low leveraged long position.
Many following this strategy have either been stopped out, liquidated or went into the red on their investments.
Meanwhile, those playing both sides of Bitcoin’s price action will have recognized that the current trend of dropping to the lower trendline of the descending channel is followed by a strong oversold bounce that culminates with a brush against the main descending trendline where traders will have opened shorts, which they ride back down to lower trendline. Wash, rinse, repeat.
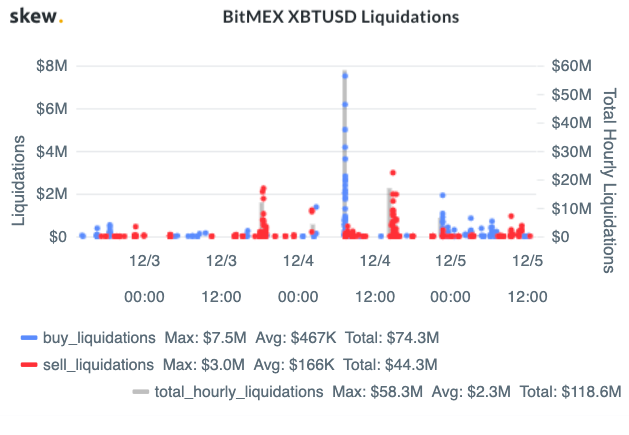
BitMEX XBTUSD Liquidations chart. Source: Skew.com
According to data from Skew Markets, yesterday’s surge liquidated nearly $60 million in BitMEX leveraged positions. Additional news of the week that might weigh on investor sentiment was crypto Twitter chatter that Bakkt’s Bitcoin futures contracts are only 37% backed by Bitcoin, rather than the long purported 100% backing. Furthermore, in the late hours of Dec. 4, crypto media reported that Bakkt CEO Kelly Loeffler is departing Bakkt to serve as a United States Senator representing the state of Georgia.
Surely this news does not bode well for investor sentiment but it’s likely that the narrative will soon shift to something along the lines of suggesting that Loeffler can advocate for crypto-supportive legislation from her new position as a senator.
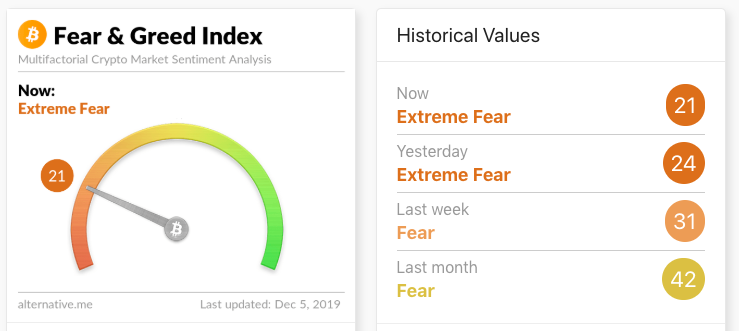
Fear & Greed Index. Source: alternative.me
The Crypto Fear & Greed Index reading is back to “Extreme Fear.” Given that investors perceive the indicator as a counter trading signal, some will look at Bitcoin’s current price action as another opportunity to accumulate or at least open long positions. Risk-averse investors will likely interpret the reading as a further warning that Bitcoin price could fall to new multi-month lows if it fails to hold $7,000.
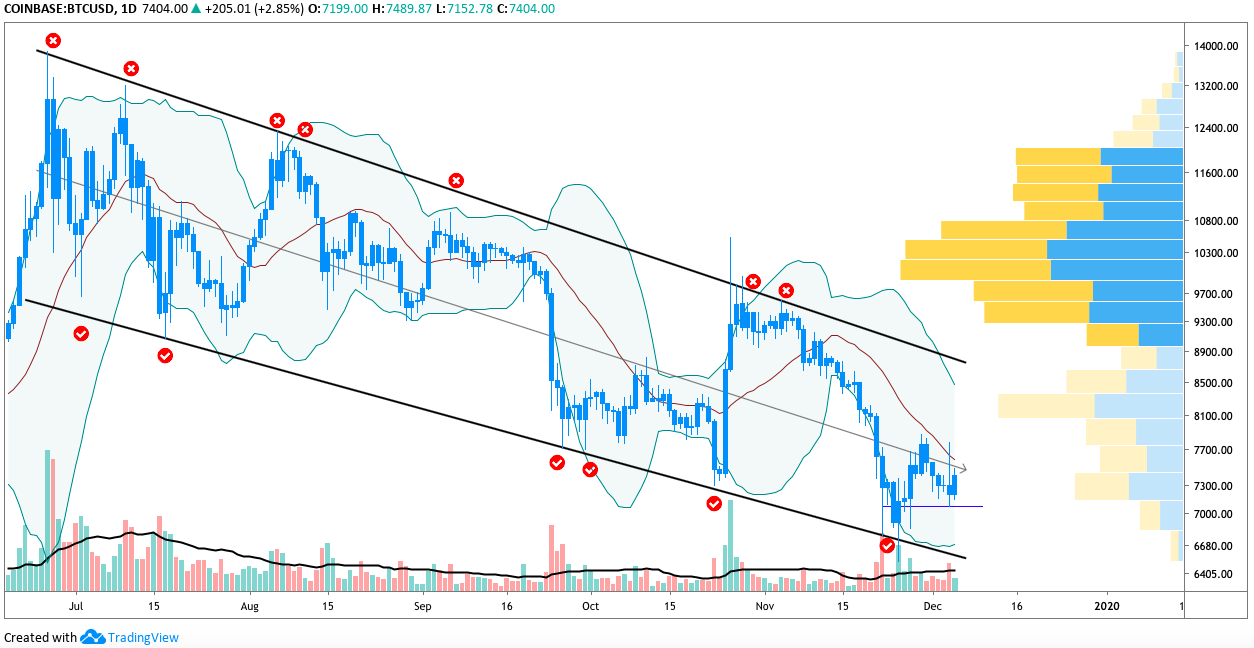
Today, Bitcoin is attempting to replicate yesterday’s performance but is finding resistance at the descending channel midpoint ($7,512), which also aligns with the moving average of the Bollinger Band indicator.
BTC USD daily chart. Source: TradingView
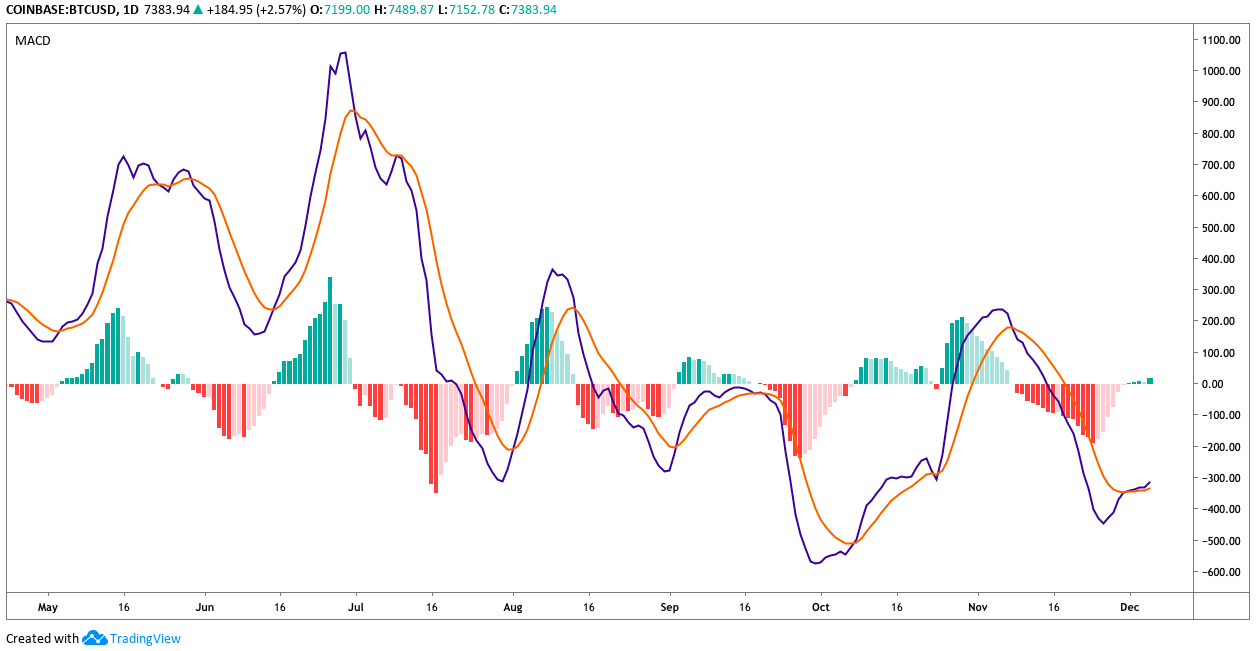
BTC Daily MACD chart. Source: TradingView
Over the past few days, the moving average convergence divergence (MACD) indicator managed a bull cross and the histogram flipped positive. But the current momentum leaves traders wanting to see more volume and range in Bitcon’s price action as it has been unable to hold onto gains or sustain above the 12-period EMA.
Currently, purchasing volume is rising and if the price can push above the Bollinger Band moving average, Bitcoin could rise to $7,976.
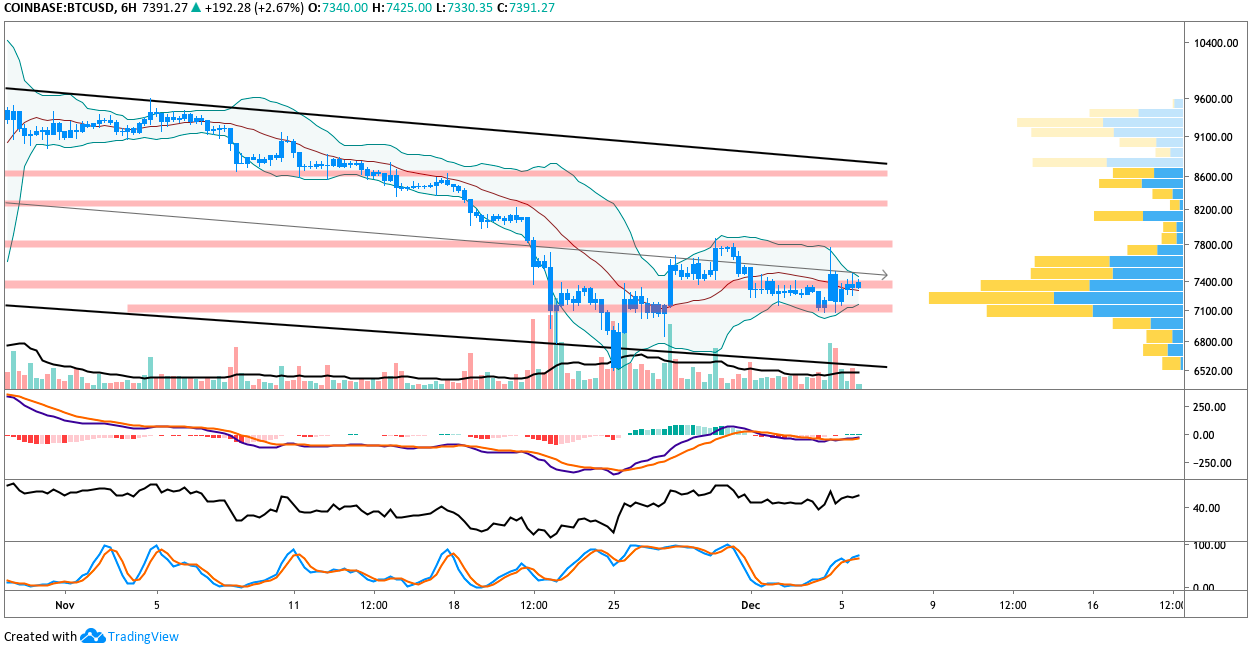
BTC USD 6-hour chart. Source: TradingView
As shown by the 6-hour chart, Bitcoin is showing some bullish behavior. The 12-point exponential moving average (EMA) is slowly pulling its way up to cross above the 26-EMA and the price is pressing against the $7,400 resistance. As observed on the daily chart and mentioned earlier, the MACD histogram continues to gain momentum but more purchasing volume will be required to push Bitcoin price through $7,400-$7,600.
BTC USD 6-hour daily chart. Source: TradingView
The relative strength index (RSI) has climbed back into bullish territory and the Stochastic RSI is quickly rising toward 80. Traders will also notice that the Bollinger Bands are tightening and the price is slightly above the indicator’s moving average.
All of this suggests a larger move is in the making and the VPVR shows that price could run towards $8,000 if bulls can press the price through the zone mentioned above ($7,400-$7,600).
A drop below $7,080 could see the price sink to $6,800 and if buyers fail to buy into the dip the price could revisit the previous double bottom at $6,524. If bulls ignore this level, then $5,250 is likely to be the next target.
As shown by the daily chart and mentioned in a previous analysis, the run-up from $4,000 to $13,800 was rapid and minimal support was built from $7,200 to $5,300. So the price could quickly slice through this zone if BTC price drops below the descending channel support.
The views and opinions expressed here are solely those of the author (@HorusHughes) and do not necessarily reflect the views of Cointelegraph. Every investment and trading move involves risk. You should conduct your own research when making a decision.


