The price of Bitcoin (BTC) is approaching the last weekly candle for the month of August. Some traders believe Bitcoin’s performance over the next two weeks could decide whether its price drops below $10,000 again or sees an extended uptrend.
The week’s weekly candle close coincides with the expiration of CME’s Bitcoin futures contracts and Deribit’s options contracts. It could potentially set a precedent for September, especially if Bitcoin closes above or below key levels.
In the short term, technical analysts generally consider $11,800 as the key level for Bitcoin. A high time frame close below the level would raise the chances of a deeper pullback. A close above it, maintaining a green monthly candle, could cause Bitcoin to see another leg up.
Mohit Sorout, a founding partner at Bitazu Capital, said in a tweet that a rally to $11,800 would “put sellers to sleep.” Sorout referred to the daily chart of Bitcoin with Bollinger Bands, showing the area of interest for both sellers and buyers.
With just a few days left until the monthly close, the Bitcoin futures market remains cautious. Typically, the number of long contract holders in the futures market outweigh short-sellers. Data from Bybt shows longs represent 53.36% of the market, which shows traders are cautious, heading into September with three major scenarios on the cards.
The short-term bullish scenario for Bitcoin
For Bitcoin to maintain its upward momentum in the near term, traders say BTC’s price primarily needs to recover back above the $11,800 support-turned-resistance level. If that happens, traders foresee another potential move to $12,500. However, some other traders believe that the major support trendline of Bitcoin places the next support area at around $10,900. Thus, if BTC stays above the $10,900-to-$11,500 range, it would maintain its short-term bull scenario.
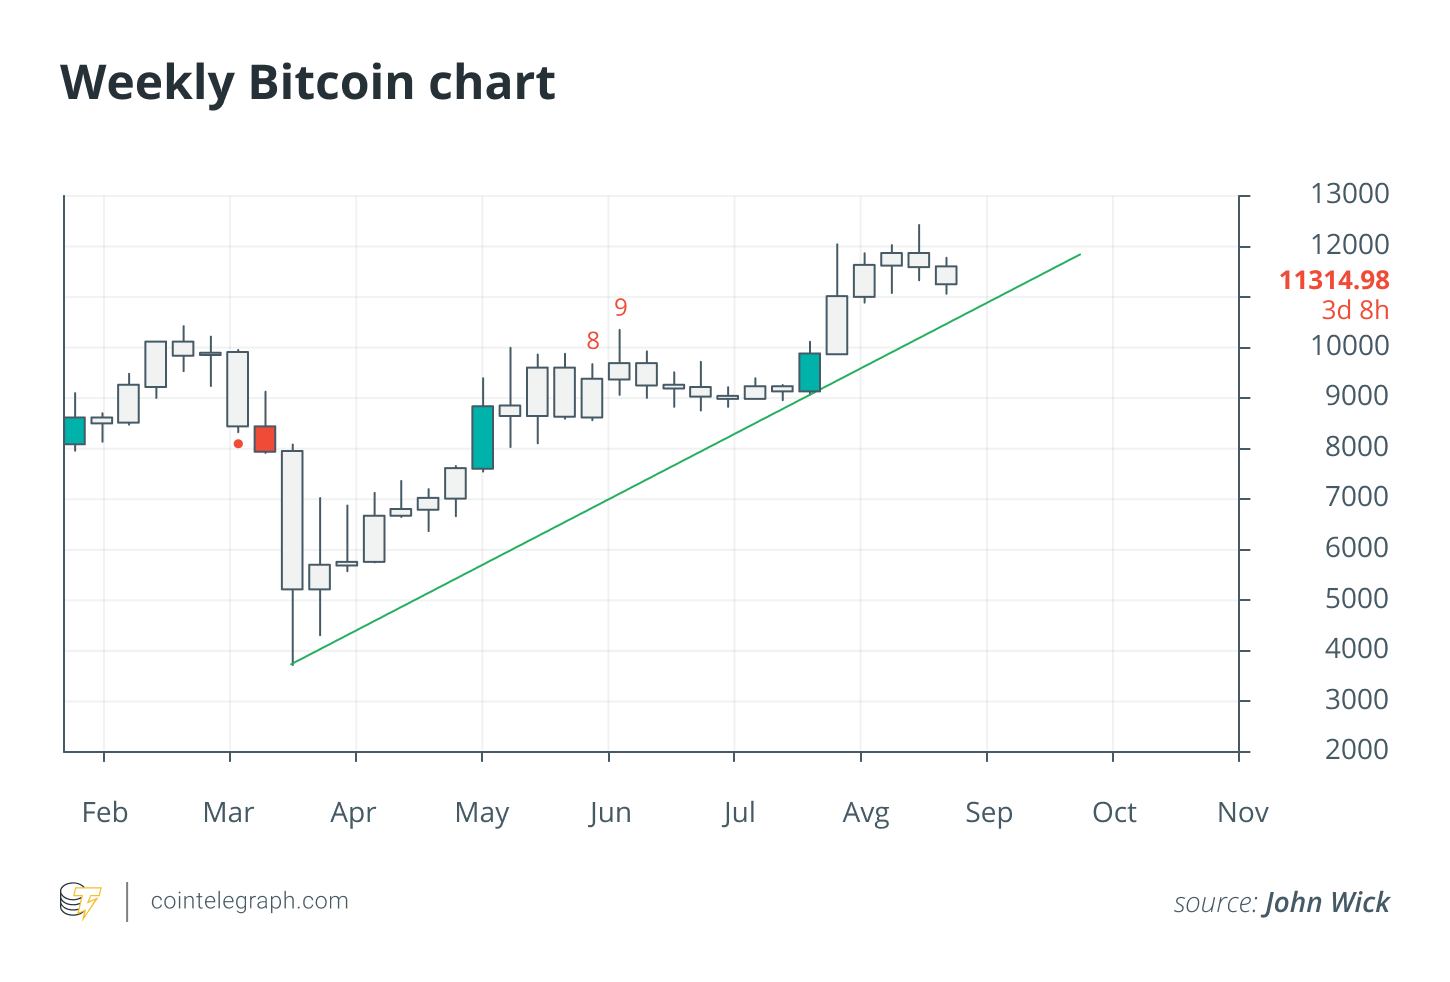
A cryptocurrency trader known as “John Wick” believes investors are not considering the higher time frames, as the weekly chart, which uses Bitcoin’s $3,600 bottom in March and $9,130 local bottom in July as basis points, shows a supporting trendline. As long as the trendline does not break intensely in the short term, the trader hinted in a tweet that this could be an optimistic market structure.
Cryptocurrency analyst Nunya Bizniz suggested a similar scenario in a higher time frame. If the current monthly candle structure follows previous formations, the analyst said there is a chance it marks the start of a newfound bull run. That would indicate that Bitcoin’s price potentially sees a stable climb over the next six to 12 months, tweeting:
“BTC Monthly: VWAP anchored to previous cycle highs. A successful retest of the AVWAP has lead to bull markets. Does the current month satisfy the retest and will it lead to a bull run [this] time? Note: Grey vertical line = halving.”
However, one variable in the expectations of a 2017-like rally is that the second halving occurred in mid-2016. If a similar trend were to emerge, the chances of Bitcoin seeing a proper rally are higher in late 2021, rather than during the upcoming winter.
BTC’s cautiously bearish case
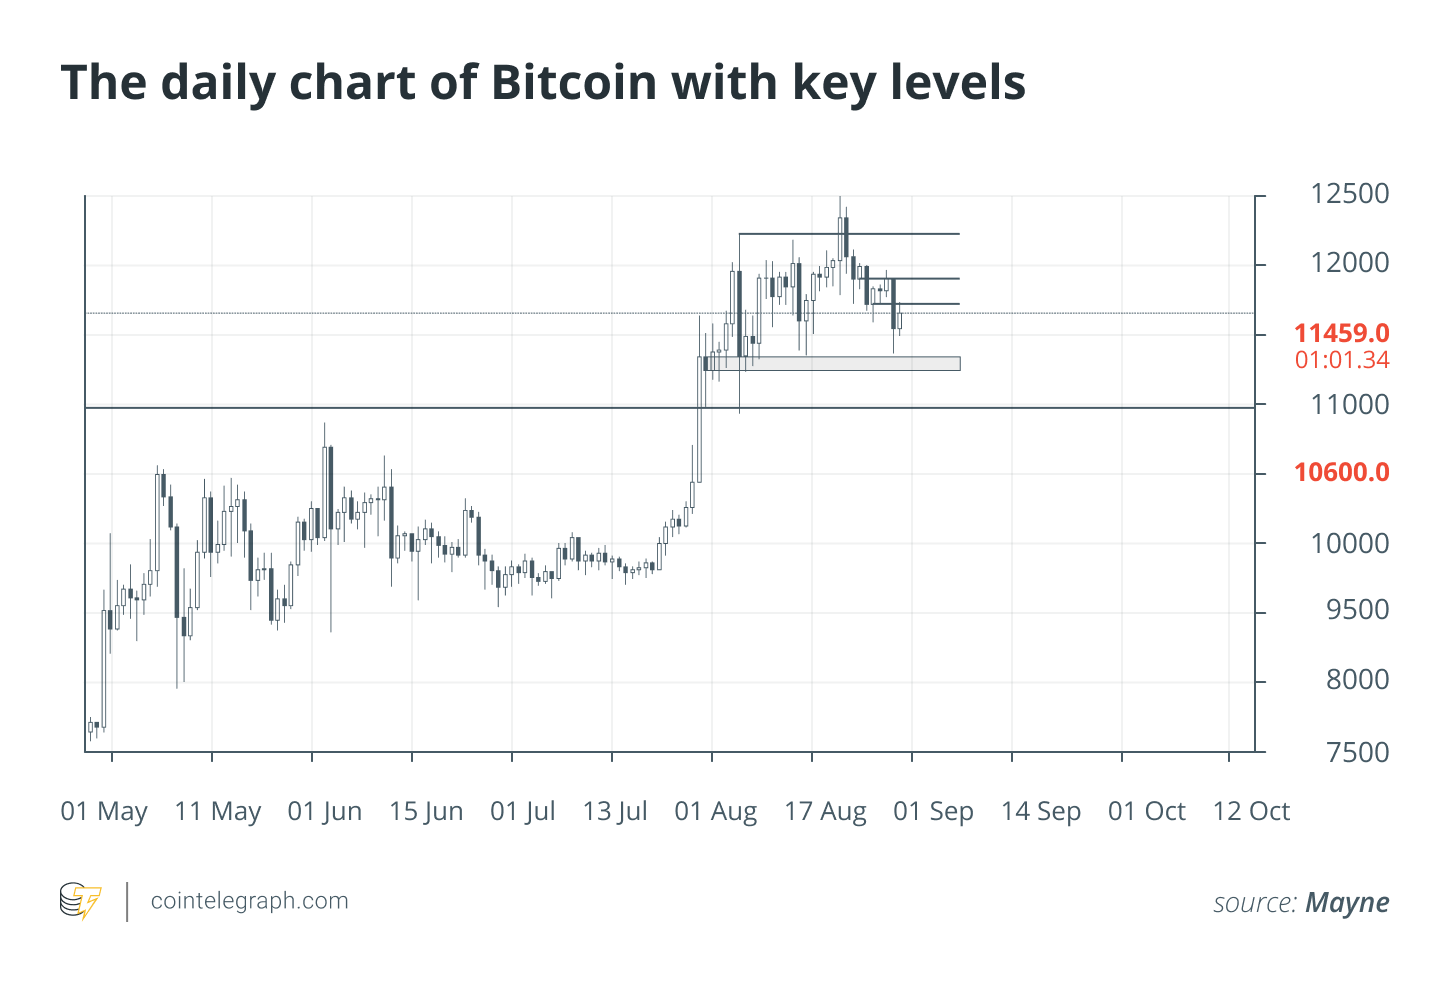
In the short term, traders started to show signs of caution following Bitcoin’s drop below $11,500. A trader known as “Mayne” said that the initial decline of Bitcoin to $11,400 is not a trend bulls want to see. Since then, Bitcoin has seen a consecutive lower high pattern, which typically shows slowing momentum. Mayne tweeted: “Price with a false break high and now stair stepping down. Last 2 up moves seem like clear bearish retests. If this is distribution, expect the selling to pick up speed soon. Bulls need to come in and regain $11.7.”
A lower high formation refers to when the price peaks at a lower price than the previous high. Bitcoin’s daily candle closed at $11,748 on Aug. 24, while the following three daily candles all closed under $11,500, forming a lower high pattern. Bitcoin would have to break above $11,800 to cancel out the lower high pattern, which makes it a critical short-term level.
The slowing momentum of Bitcoin since its peak in mid-August coincides with declining address activity. CNBC’s Brian Kelly have used the daily address activity on the Bitcoin blockchain as a key fundamental metric for some time. Since May, the address activity on the Bitcoin network has noticeably declined, as data by Santiment shows it has dropped by nearly half, clarifying that the decline in address activity is a sign of caution that network activity is seeing a slump. The company tweeted: “The -3.7% price was surely related to this metric’s -19.3% decline since its peak of 1.13M active addresses back on August 6th.”
The confluence of lower highs on the daily chart, slowing fundamental metrics and the consolidation of Bitcoin under $11,800 is seemingly swaying the market to become more cautious.
Stagnation
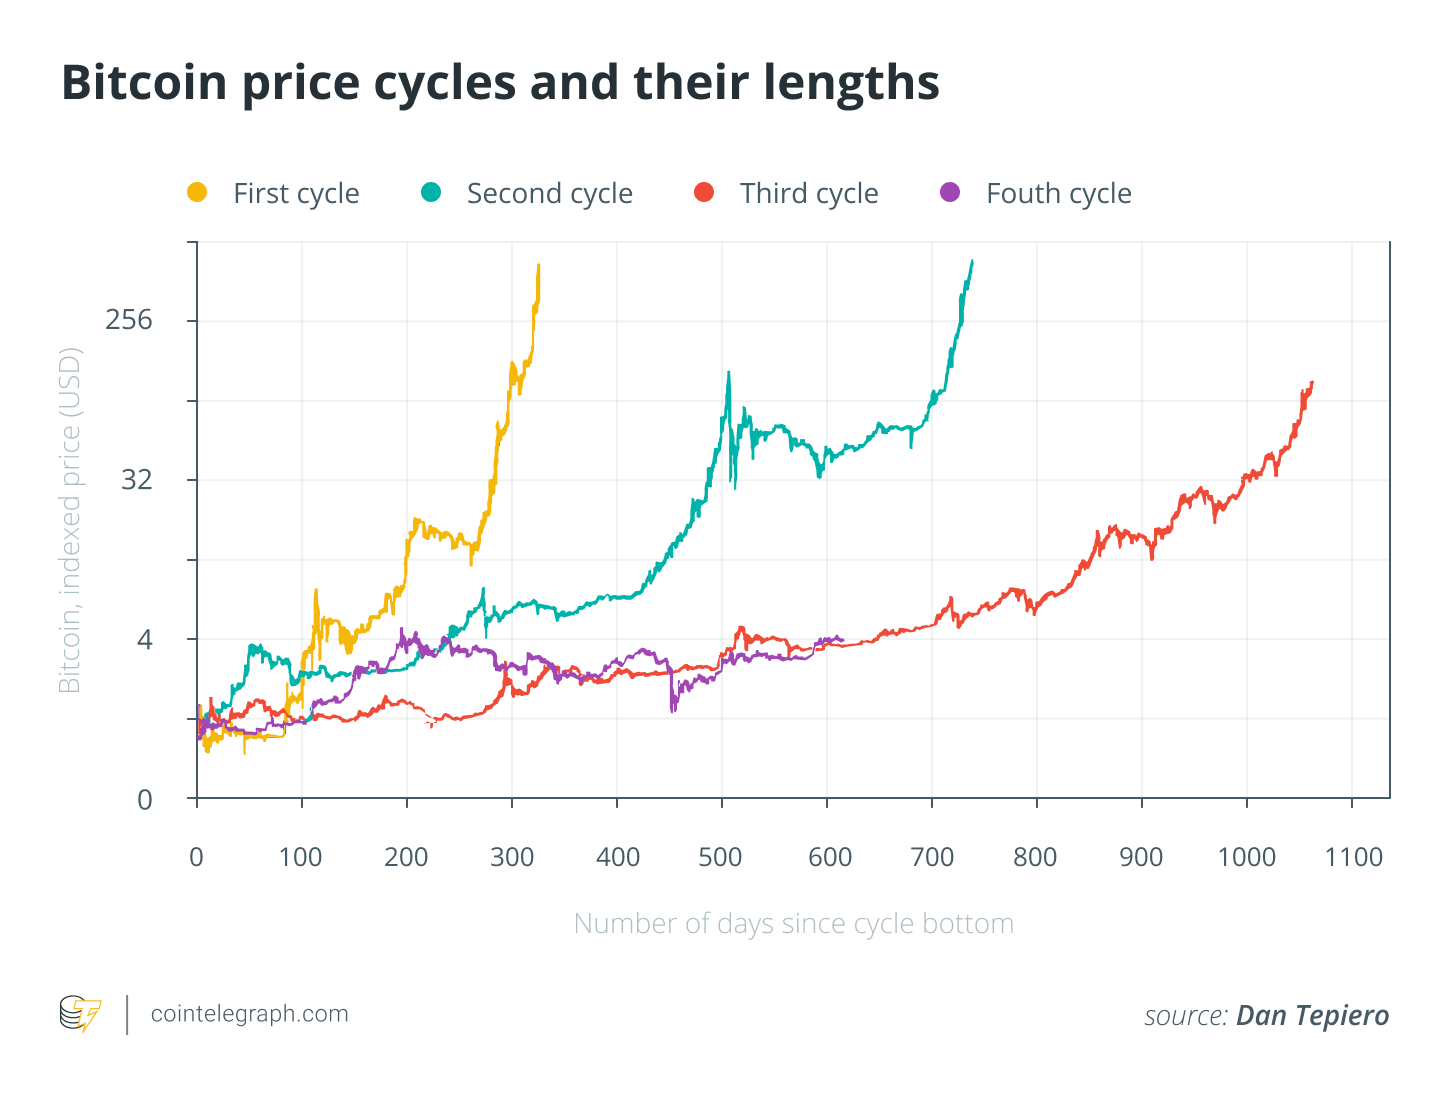
As an alternative scenario, some investors believe Bitcoin could see months of low volatility before the next big price movement. Dan Tepiero, a co-founder of 10T Holdings, said that every price cycle in the past took around 800 to 1,100 days to complete. Bitcoin is currently less than 400 days into the cycle, which indicates that BTC could range sideways for the next three to 12 months.
If the price of Bitcoin continues to remain stagnant, some foresee an extended altcoin season. The Bitcoin dominance index is a concern for altcoins in the foreseeable future, as it is approaching key technical support levels. But, historically, altcoins have prospered during a Bitcoin consolidation phase.
Related: Alt season is here? DeFi tokens taking on Bitcoin for crypto dominance
Tepiero urges everyone to be patient with Bitcoin, tweeting: “Each up cycle takes longer to play out and is less extreme as absolute dollar value gets much larger. May or may not be another 6-12 months before price breaks up. Should not matter as end price point obscenely higher. Hodlers rejoice.”
Traders remain mixed as Bitcoin enters September, which, historically, has been a slow month. In previous years, BTC often saw an uptrend in August, followed by consolidation until November. The tendency of BTC to stagnate throughout the last quarter of the year is reflected by the lack of decisiveness in the futures market.


