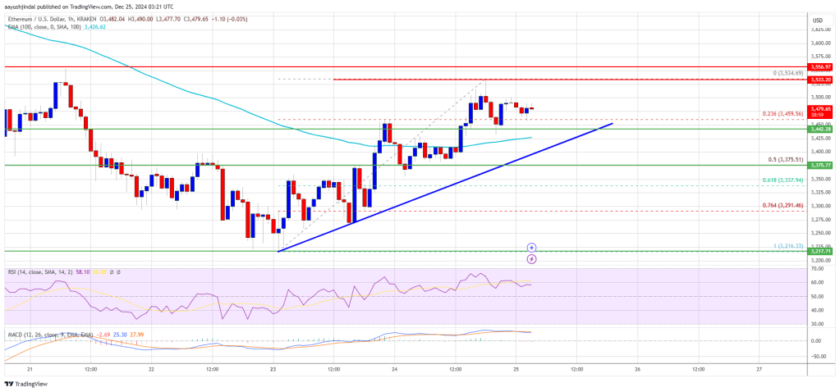
Key Highlights
- ETH price recovered nicely and moved above the $210 level against the US Dollar.
- There is a key bearish trend line in place with resistance at $216 on the hourly chart of ETH/USD (data feed via Kraken).
- The pair must break the $216 and $220 resistance levels to move further higher in the near term.
Ethereum price is mostly consolidating against the US Dollar and bitcoin. ETH/USD is likely to decline a few points towards $205 before moving higher.
Ethereum Price Support
After a major downside correction towards the $190 level, ETH price found support against the US Dollar. The ETH/USD pair traded as low as $192 and later started an upward move. It jumped sharply above the $195 and $200 resistance levels. There was also a break above the 50% Fib retracement level of the recent decline from the $228 high to $192 swing low.
The price also settled above the $205 level and the 100 hourly simple moving average. However, the upside move was capped by the $214-215 zone. The 61.8% Fib retracement level of the recent decline from the $228 high to $192 swing low also acted as a hurdle. Moreover, there is a key bearish trend line in place with resistance at $216 on the hourly chart of ETH/USD. The pair needs to break the trend line and the $218 level to trade further higher. The current price action indicates that the price could correct a few points lower before it could rise back above $216.
Looking at the chart, ETH price may dip a few points towards the $206 and $205 support levels. Below these, the price could even test the $200 zone before it crawls back above the $216 level. Above $216, the price may perhaps break $220 for more upsides.
Hourly MACD – The MACD is placed slightly in the bullish zone.
Hourly RSI – The RSI is currently positioned nicely above the 50 level.
Major Support Level – $205
Major Resistance Level – $216


