Key Highlights
- ETH price declined further below $415.00 and traded as low as $407.95 against the US Dollar.
- There is a crucial bearish trend line in place with resistance near $428 on the hourly chart of ETH/USD (data feed via Kraken).
- The pair has to move above the $428 and $430 resistance levels to gain upside momentum.
Ethereum price is under pressure against the US Dollar and bitcoin. ETH/USD is correcting higher towards important resistances near $428-430.
Ethereum Price Upside Hurdles
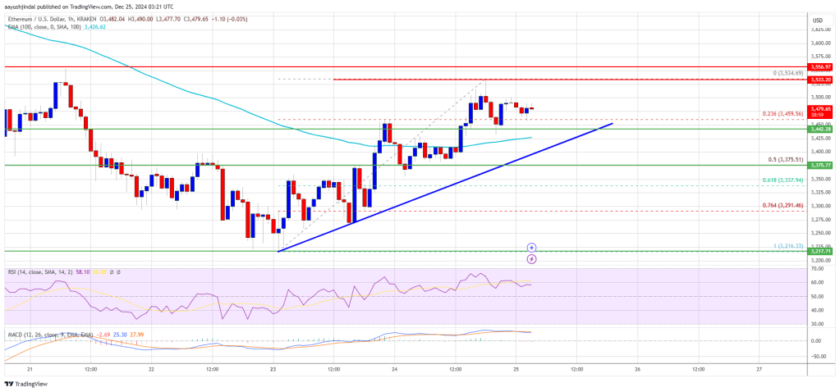
There were further losses in ETH price below the $420 level against the US Dollar. The ETH/USD pair extended losses below the yesterday’s low at $411 and broke the $410 level. A new low was formed at $407.95 before the price started an upside correction. It moved above the 23.6% Fib retracement level of the last slide from the $435 high to $407 low.
There was also a break above a short-term connecting bearish trend line at $418 on the hourly chart of ETH/USD. However, the price is facing many hurdles near the $424, $426, $428 and $430 levels. There is also a crucial bearish trend line in place with resistance near $428 on the same chart. An immediate resistance is near the 61.8% Fib retracement level of the last slide from the $435 high to $407 low at $425. It seems like it won’t be easy for ETH buyers to break the $428-430 resistance zone in the near term. Above $430, the price may perhaps test the 100 hourly simple moving average, which is currently at $439.
Looking at the chart, the price is showing a few positive signs above $418. However, it must clear the $428 and $430 hurdles for a larger correction. If not, there is a risk of a fresh downside move below $415.
Hourly MACD – The MACD is slightly placed in the bearish zone.
Hourly RSI – The RSI is currently above the 50 level with a minor bearish angle.
Major Support Level – $412
Major Resistance Level – $428


