
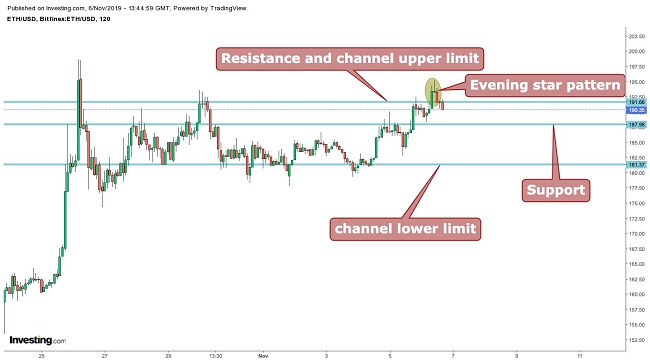
When looking at the chart below we can see that Ethereum (ETH)trade is trading at $190.70. It can also be seen that the second-largest cryptocurrency’s price is back in the channel after a false break out.
The upper limit of the channel at $192 is also acting as resistance and $187 is acting as support. The lower limit of the channel is $181. There is also a formation of an evening star pattern, which is a bearish reversal pattern indicating further correction. The price is expected to trade inside the channel.
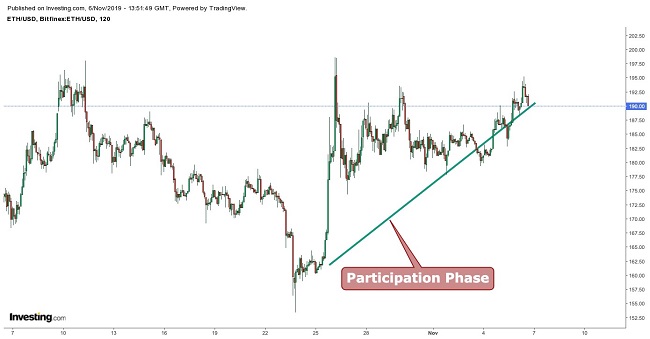
Dow Theory
According to the Dow Theory, Ethereum’s price is currently trading in the public participation phase. During this phase, the market catches on to new investors and a rapid price change occurs; the change occurs when trend followers and other technically oriented investors begin to participate.
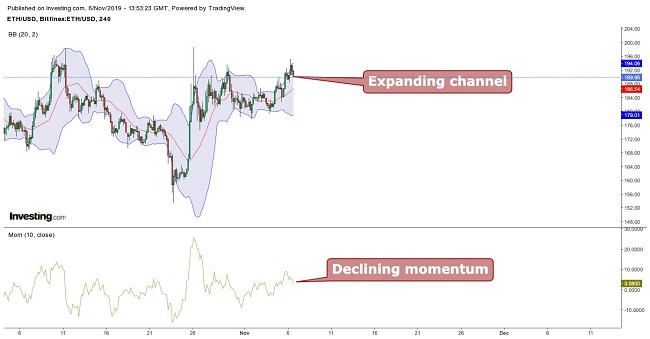
Bollinger Bands
The ETH price is moving between the channels with the lower channel limit acting as support and the upper limit as resistance. The channel is expanding, indicating an increased volatility but the momentum is declining, which signals a downtrend so we might see a further correction.

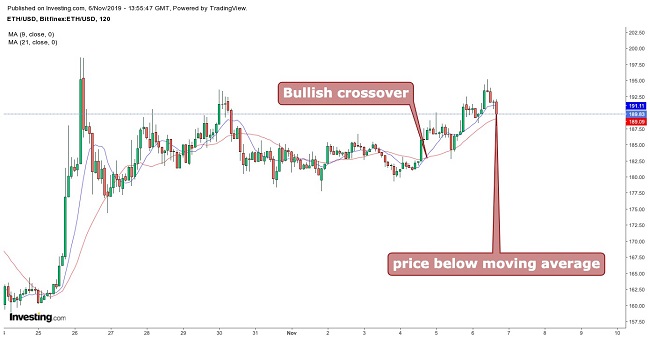
Moving Average
When taking 9 period moving averages (blue) with 21 period moving averages (red) a bullish crossover is seen; yet, the cryptocurrency price is trading below the 9 period moving average.
This indicates a bearish sentiment so it is suggested to take long positions only around the support level and the target price at the resistance level, and only after the price starts trading above the 9 period moving average.
Conclusion
Ethereum (ETH)trade is currently trading at $190.70. The resistance is at $192 and $187 is acting as support. It is suggested not to take long positions at this current price as it is near the resistance level with a formation of an evening star pattern, so further correction is expected.
Swing trading can be done, setting the target price at the resistance, and setting the support as the buying point. The digital currency is expected to trade inside the channel, presently without any indication of a breakout.
Pivot Points
| Name | S3 | S2 | S1 | Pivot Points | R1 | R2 | R3 |
| Classic | 159.88 | 168.54 | 176.23 | 184.89 | 192.58 | 201.24 | 208.93 |
| Fibonacci | 168.54 | 174.79 | 178.64 | 184.89 | 191.14 | 194.99 | 201.24 |
| Camarilla | 179.42 | 180.92 | 182.42 | 184.89 | 185.42 | 186.92 | 188.42 |
| Woodie’s | 159.40 | 168.30 | 175.75 | 184.65 | 192.10 | 201.00 | 208.45 |
Technical Indicators
| Name | Value | Action |
| RSI(14) | 47.908 | Neutral |
| STOCH(9,6) | 37.410 | Sell |
| STOCHRSI(14) | 67.458 | Buy |
| MACD(12,26) | 0.560 | Buy |
| ADX(14) | 19.459 | Neutral |
| Williams %R |
-56.886 | Sell |
| CCI(14) | -1.2866 | Neutral |
| ATR(14) | 29.7216 | Less Volatility |
| Highs/Lows(14) | 0.0000 | Neutral |
| Ultimate Oscillator |
44.909 | Sell |
| ROC | -14.176 | Sell |
| Bull/Bear Power(13) |
-13.7480 | Sell |
What do you think about the article?

If You Liked This Article Click To Share