Bitcoin (BTC) closed the week down 0.39% at $7,356 having recovered very quickly from a daily close, which saw BTC trading down at $6,850 for a short period on Friday morning. Since then, Bitcoin has recovered over 10% and is once again pushing hard against resistance on Monday.
All other cryptos are up over the last 24 hours, most outperforming Bitcoin, with XRP being up close to 9% while just about all other top cryptos posting gains of around 5%.
This is a trend change. With Bitcoin recently leading the market, it could be a sign of renewed interest from the cryptocurrency bulls. As a result, Bitcoin dominance has fallen very slightly below 68%.
Cryptocurrency market 24-hour view. Source: Coin360
BTC price: 1-week chart
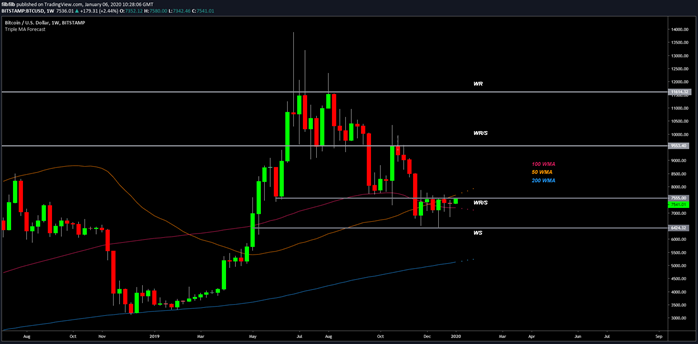
The one week chart shows that the price of Bitcoin continues to press hard against the resistance of $7,555, which has failed to be broken on a weekly basis since it was lost mid-November.
Continued rejections in the $6,000s and a recent pattern of overall higher lows demonstrate that upward pressure is building at this moment.
BTC USD Weekly chart. Source: TradingView
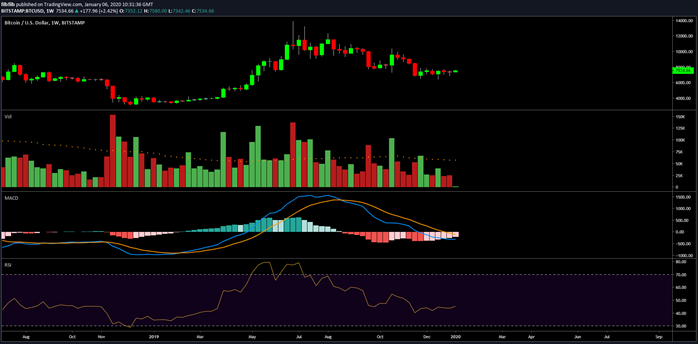
Meanwhile, volume continues to decrease on spot exchanges and in an overall decline, but there are notable large green candles when price lows have been tested, which hints at accumulation.
The moving average convergence divergence indicator, or MACD, continues to build a bullish divergence on its histogram, which is into its sixth week of higher lows while price has been stagnant. But we are likely to remain a few weeks away from a bullish cross unless there is a breakout.
The RSI has clearly stopped breaking to the downside and looks to be drifting bullish above 50.
BTC USD Weekly chart. Source: TradingView
1-day chart
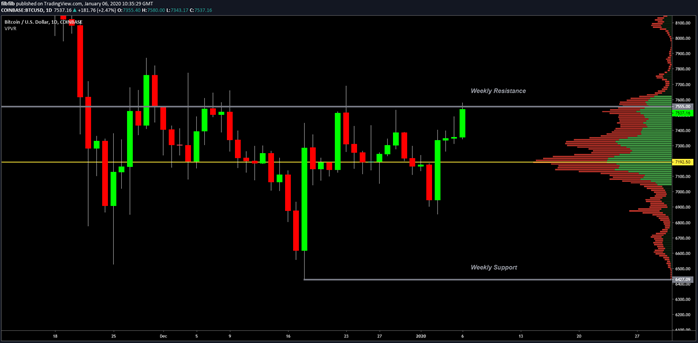
The daily chart for Bitcoin clearly demonstrates the bullish picture on Monday morning with a large green candle pushing hard up against resistance that has emerged following a failure to break $7,555 previously, which resulted in a selloff that we discussed as a likely outcome last week.
A large-bodied daily candle will be what the bulls are looking for. There has been continued short interest at this level for weeks and we should expect the same until the rule is broken, and the response from the United States in the first couple of hours trading will be very telling today.
BTC USD 1-day Chart. Source: TradingView
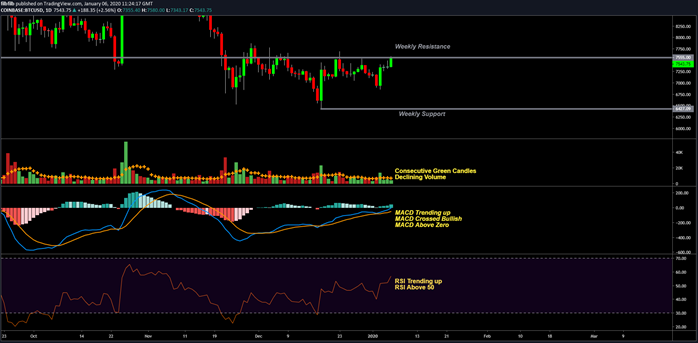
The point of control has been acting as a good area of support for the bulls around $7,200 with it only briefly being lost on three occasions. The daily candles show four back to back green candles, which has not occurred since July, and the most notable volume bars appear to be won by the bulls, which is a positive sign.
The MACD has also been trending to the upside for weeks with a bullish cross with its signal line and has now crossed its zero line, meaning the underlying 12 and 26 EMAs as now crossed bullish.
The RSI is also breaking out to the upside and trending above 50. Each of these indicators demonstrates multi-week bullish momentum, which is now technically being confirmed (pending a move in price).
BTC USD 1 Day Chart. Source: TradingView
4-hour chart
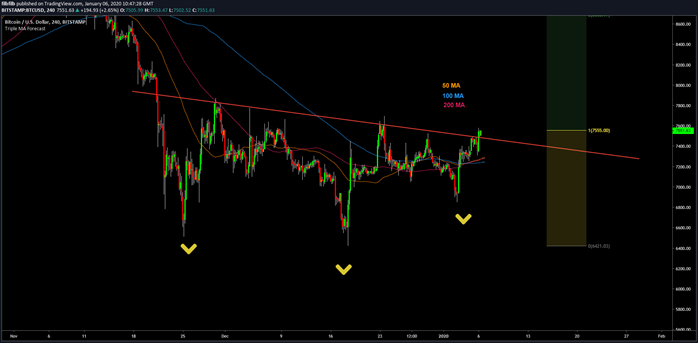
The 4-hour chart clearly shows a case for the bottoming pattern for an inverse head and shoulders, which is supported by declining volume as one would expect to see with this pattern.
Each of the key moving averages is also all crossed bullish. In addition, the 4-hour chart is trying to build upon the close above declining resistance. Combined with the daily close currently being up against horizontal resistance, this is clearly a pivotal moment.
BTC USD 4-hour chart. Source: TradingView
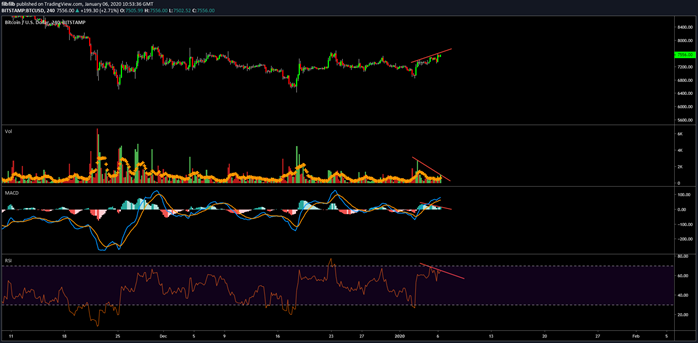
The 4-hour chart does show some signs of weakness with declining volume, declining MACD pressure and again the same on the RSI while the price has been appreciating.
This is unsurprising due to the overhead resistance and the outcome is likely to be determined as U.S. traders wake up.
BTC USD 4-hour chart. Source: TradingView
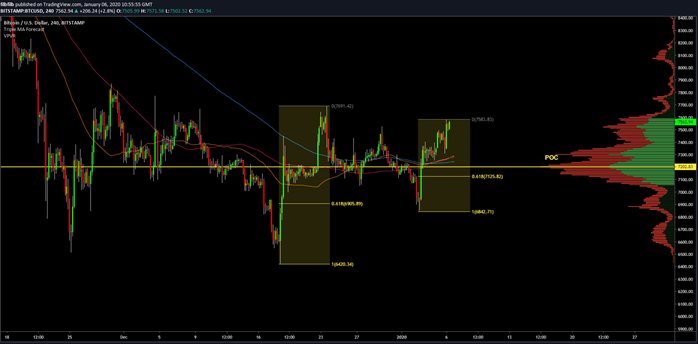
Should Bitcoin breakdown, the most likely port of call will be $7,000-7200 where the point of control lies since it has been acting as resistance and support for weeks.
It is also the 61.8% retracement of the move from last week’s lows. So if Bitcoin is rejected, this could be an area of buying interest. A failure to hold the point of control again could mean that the $6,000s may need to be backtested to see if another higher low can be printed, which would need to be above $6850.
Failure to close above here on the daily chart would most likely mean that Bitcoin is destined to head lower.
BTC USD 4-hour chart. Source: TradingView
Looking forward
Clearly, the price of Bitcoin is shaping up for a big move. Currently, bulls appear to have momentum on their side, but there is the underlying issue of the overall downtrend in which Bitcoin remains locked in since summer.
A break out to the upside could still follow with rejection and more downside. The objective is simple for the bulls: defend $7K and reclaim $7,555 as support.
If there are still bloodthirsty bears, they may simply be waiting for liquidity to short at higher levels. All eyes will be on the U.S. today and the first half of the week will be critical for market participants who are eagerly anticipating the next move.
The views and opinions expressed here are solely those of the author and do not necessarily reflect the views of Cointelegraph. Every investment and trading move involves risk. You should conduct your own research when making a decision.


