- The short-term moving average on Bitcoin’s daily chart is flattening out.
- The phenomenon comes after the cryptocurrency hits the highest level since mid-March sell-off.
- Coupled with favorable fundamentals, such as halving, the MA indicates an extended bull run towards or beyond $9,000.
A lagging technical indicator that determines bitcoin’s near-term market bias has flattened out in favor of bulls. And it could lead the cryptocurrency to test $9,000.
The 50-day moving average (saffroned) identified a bullish reversal scenario for the first time since January 2020 as its curve crawled to the sideways after weeks of downward momentum. The bounce-back phenomenon tailed bitcoin’s price rally above $7,800, representing a 100 percent recovery on the bottom logged on March 13.
The cryptocurrency closed above the 50-DMA wave during its uptrend, further strengthening its near-term bullish bias. The saffroned curve can now act as a support, from where the price can bounce off to continue its price rally. Nevertheless, a close below the 50-DMA also marks the return of bears.
That is visible in bitcoin’s fractal from the earlier this year. The first week of January 2020 saw bitcoin breaking above the 50-DMA, after which the curve started flattening out. The move marked the beginning of a new rally that eventually shot the bitcoin price 43 percent up as on February 13, 2020.
Bitcoin is now repeating a similar scenario. First, the cryptocurrency is trading above the 50-DMA. Second, the curve is flattening out. And third, the 20-day EMA (blued curve) is now trending above the 50-DMA – another bullish fractal from January-February 2020 timeframe.
Other Bullish Indicators
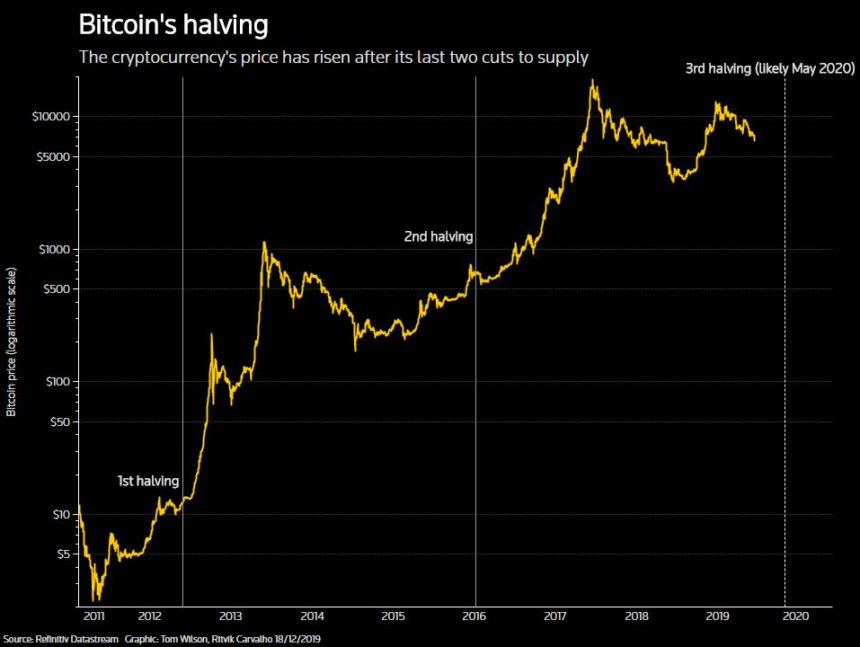
While bitcoin’s latest move above its crucial moving averages confirms an extended upside run, what’s pushing the cryptocurrency’s global bullish narrative is mining reward halving next month.
Bitcoin will undergo a daily supply rate cut on May 12, 2020, after which miners will be able to produce only 900 BTC each day, as opposed to 1,800 BTC now. Bulls believe that halving would create a supply deficit in the bitcoin market. And if demand for the cryptocurrency shoots upward, so would its prices.
“Bullish Speculative Demand for the upcoming Halving is driving prices up and allowing us to sustain higher prices,” said Kevin Swenson, a popular crypto trader. “The selling pressure is very lite. Buyers continue to show up.”
A $9,000 Bitcoin in Q2
Essential near-term bullish indicators have put the bitcoin price at $9,000 in the second quarter, providing it can break above the 200-day moving average (blued). Prominent trader Teddy Cleps thinks 200-DMA is the only resistance that is keeping bitcoin from attempting a bigger upside run.
You don’t need magical lines to understand that the only resistance is the 200ema$BTC pic.twitter.com/rn93mw0tP5
— Teddy (@TeddyCleps) April 28, 2020
The 20-50 MA crossover shows that bitcoin would continue its uptrend. The Rising Wedge pattern in purple also carves out a similar upside path for the cryptocurrency. So it appears, the BTCUSD pair could hit or breach the $9,000 in Q2 only.
Nevertheless, the Wedge also signals a deeper bearish correction once the price reaches its apex. That should bring bitcoin back t retesting the 50-DMA, which would be trending upward by then.
Photo by Ozark Drones on Unsplash


