According to the Buffett Indicator, the global stock market has entered a “bubble territory,” says Welt market analyst Holger Zschaepitz on Aug. 9. The recent correlation between Bitcoin and stocks could mean BTC is also at risk of a pullback.
The global stock market enters bubble territory. Source: Holger Zschaepitz, Bloomberg
Stocks have continuously rallied in recent weeks, buoyed by the surging appetite for risk-on assets. In the past month, the Dow Jones Industrial Average (DJIA) rose from 25,706 points to 27,433, by 6.7%.
Why stocks are showing hints of a bubble, and how it could affect Bitcoin
The Buffett Indicator measures the stock market’s valuation by dividing its market cap by the United States’ GDP. It attempts to find a fair valuation of stocks relative to the U.S. economy. When the indicator is above 100, it signals that the stock market is heading into bubble territory.
Since April, after the pandemic began, U.S. stocks surged due to favorable market conditions and multi-trillion dollar stimulus. Specifically, tech stocks substantially outperformed the rest of the stock market, pushing the market upward.
Due to various macro factors, the valuations of tech stocks are at historically high levels, relative to their earnings. Consequently, global markets entered bubble territory for the first time in 2018. Zschaepitz said:
“Global stock mkts have hit another milestone. All stocks now worth more than 100% of global GDP for the 1st time since 2018, pointing to stretched valuations. For Warren Buffett, a Market Cap to GDP Ratio >100% means stocks in bubble territory.”
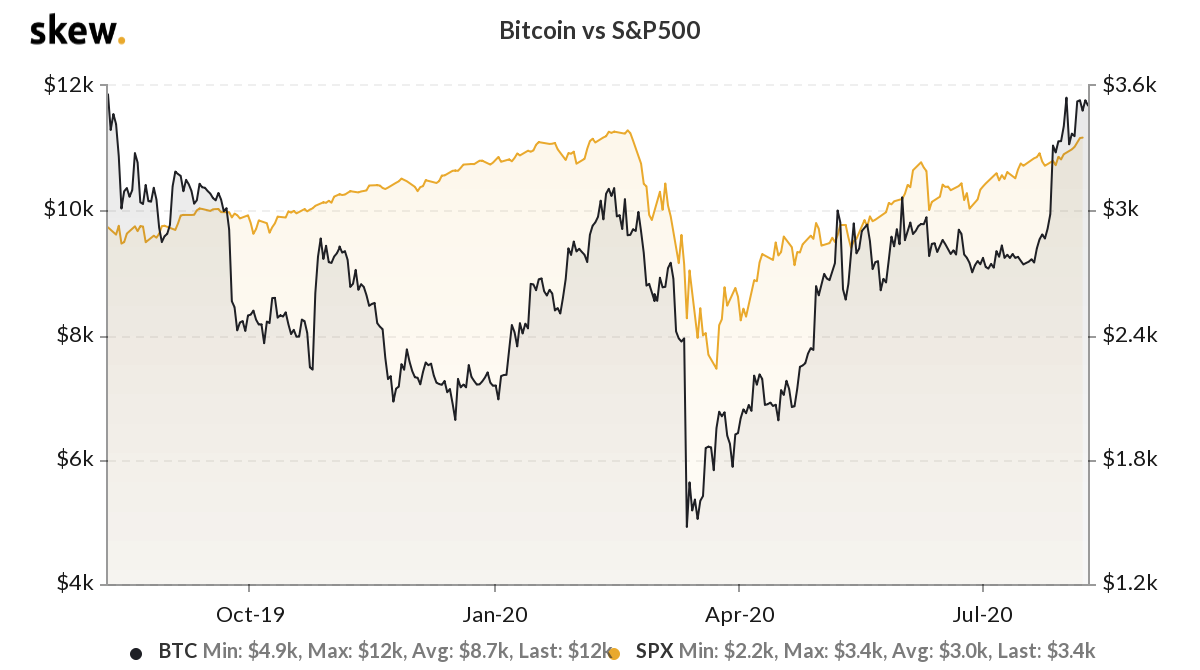
There is no conclusive link between stocks and Bitcoin other than BTC has followed the trend of stocks in the past four months. Data from Skew shows that since early July, Bitcoin closely resembled the performance of the S&P 500.
If stocks begin to drop as investors seek safety in bonds and treasuries fearing an overvalued market, it could negatively affect Bitcoin. The momentum of the stock market remains strong, and during a bullish trend, the market can remain overheated for prolonged periods.
The correlation between Bitcoin and the S&P 500. Source: Skew
Analysts not concerned about BTC in the near-term
In the short-term, analysts generally expect an uptrend due to a temporary spike in shorts. Bitcoin tends to see a short squeeze when traders start to aggressively short the market with overly-leveraged contracts during consolidation.
A pseudonymous trader known as Byzantine General suggested an uptrend is likely as many traders are holding short positions.
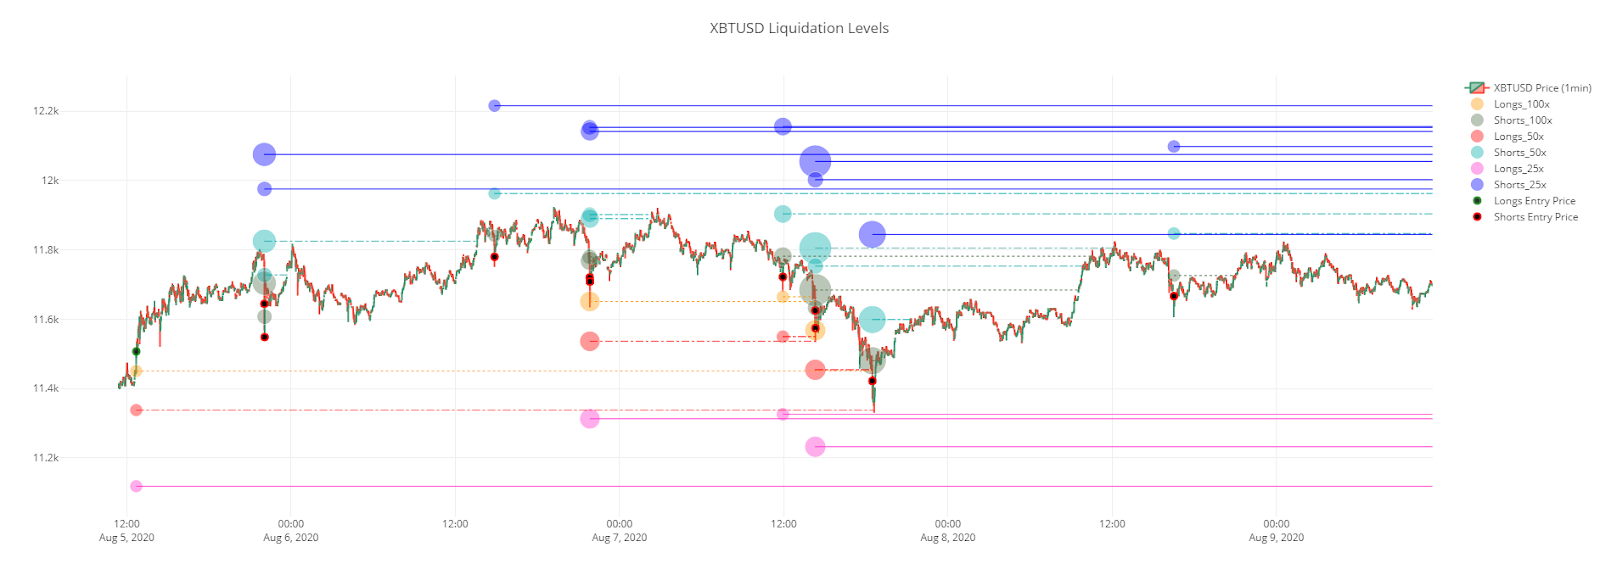
A Bitcoin liquidation level chart hints that the liquidation prices of a large number of shorts are present at around $11,800. For buyers, short liquidation levels present liquidity, and whales have the incentive to seek liquidity at higher levels.
A chart showing liquidation levels of Bitcoin shorts. Source: Byzantine General
The market structure could cause Bitcoin to rally towards the $11,800 to $12,000 range in the near term if buyers move to liquidate overly-leveraged short contracts. Another pseudonymous trader named “Satoshi Flipper” said BTC looks to be seeing a “clear consolidation before the next leg up for BTC.”


