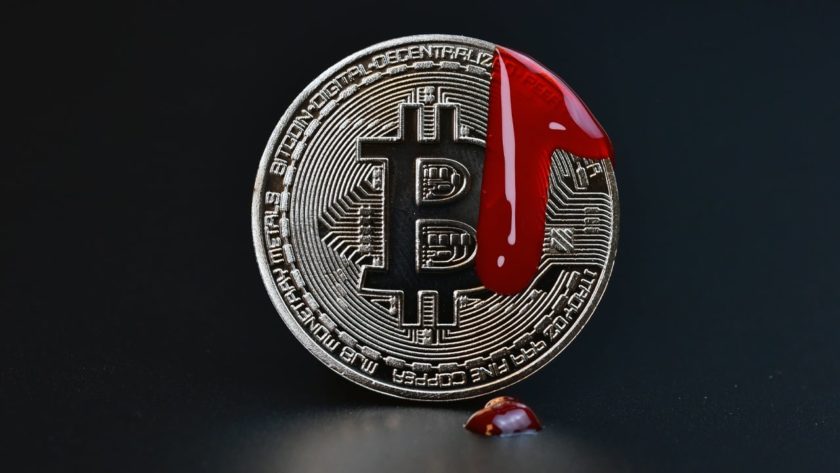
Bitcoin (BTC) has been on something of a tear as of late. You know that, of course, but the strength of this move shouldn’t be understated. In the past six weeks, the crypto asset has moved from $4,200 to $8,300 — a growth of nearly 100% — while altcoins have also seen lofty gains.
Yet, throughout this entire swing to the upside, there have been analysts incessantly calling for a correction, looking to charts to accentuate that Bitcoin rallying here is uncalled for. The technicals would agree. On-chain data shows, however, that BTC is still looking strong, and could continue even higher, barring a bad news event or another bearish catalyst of a similar caliber.
Related Reading: Study: Despite Perceived Riskiness, Bitcoin Has a Higher Risk-Return Ratio Than Most Traditional Assets
Analysts Call For A Bitcoin Correction
Bitcoin’s monumental surge over the past couple of months has caught traders with their pants down, there’s no doubt about it. Almost no one expected for the asset to pass $6,000, let alone $8,000 in early-2019. Yet here we are, sitting above a level that was a quixotic dream just months ago. Some now claim that it is a perfect time for the asset to retrace, however.
As NewsBTC reported previously, the last time Bitcoin’s chart looked as it did now, a strong pullback ensued. Analyst Josh Rager recently pointed out that during 2015’s recovery out of a brutal bear market, which was much like the one seen in 2018, BTC bottomed around $200, accumulated around $300 for months, went parabolic to tap $500, and then saw a 40% pullback. What’s more, the three-day Super Guppy, a key long-term trend indicator, didn’t signal a “buy” (green) until after the pullback.
$BTC – 3D chart Super Guppy
Amazing similarity between the last bear market prior to uptrend
Bitcoin had a similar parabolic push out of accumulation, followed by a pullback and uptrend
Watching for a potential pullback where I’ll add more to the stack pic.twitter.com/JABErMhlMq
— Josh Rager 📈 (@Josh_Rager) May 12, 2019
Sound familiar? Well, that’s because Bitcoin is seemingly doing effectively the exact same thing, but in an entirely different price region. If history is followed to an exact tee, BTC may top out around this region, plunge by approximately 40% to the low-$5,000s, and then slowly return to the $6,000 and $7,000 region.
And from there, as trader Horn Hairs points out, the cryptocurrency market should enter a period of consolidation, during which investors will be given a second chance to accumulate Bitcoin.
$BTC The last parabola that broke us out of a bear market resulted in a near 7 month consolidation. With alts at their ATL supports against USD, if this sort of consolidation happens again on BTC after it tops (likely), we could be in for the REAL #altseason. pic.twitter.com/c3WwncLyda
— HornHairs 🌊 (@CryptoHornHairs) May 11, 2019
Not So Fast, Analytics Hints
This might not happen though. First off, while the crypto market’s nature is one of intense cyclicality — booms and busts, parabolic run-ups and heartbreaking drawdowns — historical price action isn’t indicative of future performance. As Interchange’s Dan Held recently pointed out, the dynamics in this market are entirely different than 2013, 2017, or even 2018. Things have changed to put it briefly.
Case in point, the industry has some of the biggest names in finance and technology delving in. Square, through its Cash App and chief executive Jack Dorsey; Fidelity Investments; E*Trade, Bakkt, and ErisX are among the developments in the space that make this rally entirely different than anything before it. Thus, some deem it logical that warnings of a large market correction can be deemed moot.
Related Reading: Why The Next Bitcoin Bull Run Could Eclipse The Last Crypto Bubble
On-chain data may corroborate this. Renato Shirakashi, a lesser-known yet respected Bitcoin analytics guru, notes that the Spent Output Profit Ratio (SOPR), an indicator he recently created to predict local tops and lows, is currently “relatively high”, signaling a local peak. However, Shirakashi notes that this sign, which could mean there is an increase in selling pressure, would “normally push prices down”.
The big correction everyone is waiting for may not come right now. Why?
(thread)— Renato Shirakashi (@renato_shira) May 15, 2019
But with the market continuing to head higher, he suggests that demand for BTC is increasing, thereby absorbing the increase in market supply. What’s more, the median lifespan of unspent outputs isn’t changing, meaning that “HODLers” continue to “HODL”, and that the only BTC being circulated on exchanges right now are those recently mined. As Shirakashi explains:
“If we take a look at the median lifespan of outputs, we can see it isn’t changing. This means that old coins are not getting into trades. It looks like that long time hodlers aren’t willing to sell. This makes our supply limited to the circulating coins.”
This doesn’t bode well for a correction, as “demand increasing with a limited supply [of coins]” makes such a move near improbable.
Featured Image from Shutterstock


