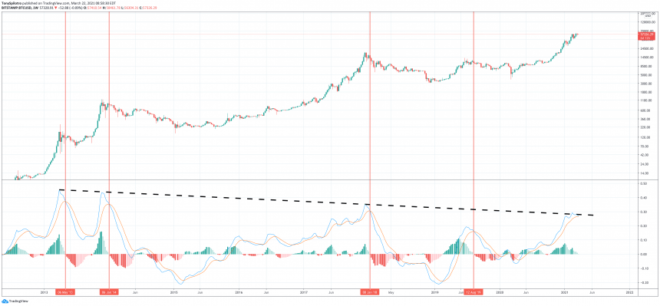
Bitcoin price is down nearly 10% from recent highs set earlier this month, but the underlying strength of the price action is beginning to fade ever so slightly.
The weekly MACD is also turning , potentially ready to cross over for the first time in months. Here’s how such a bearish crossover could result in as much as a 50 to 70% correction in the leading cryptocurrency by market cap.
Is The Bitcoin Bull Market Coming To A Conclusion Soon?
Bitcoin by most standards has been in uptrend for a full year now, dating back to Black Thursday in March 2020. The trend began to turn slightly up even before then, dating back to the bottom of the bear market in 2018.
From that bottom, the top cryptocurrency rocketed from lows but momentum finally ran out before new highs were reached. This last push, was successful in breaking through former resistance and setting a new all-time high three times the last cycle’s peak.
Related Reading | This Bitcoin Metric Says The Bull Market Might Soon Be Over
However, things could be once again turning down, much like they did in 2019. Or worse yet, according to the Moving Average Convergence Divergence on weekly timeframes, this could be the end of the bull market for some time.
At the very least, data shows that if a bearish crossover happens – something that Bitcoin is just inches away from – a between 50 to 70% correction typically follows.
Momentum is turning down, and past instances show steep corrections | Source: BTCUSD on TradingView.com
What Momentum Says About The Current Cryptocurrency Market Cycle
Looking at the above chart, the correlation between the logarithmic version of the MACD and past peaks are undeniable. When the MACD crosses bearish on weekly timeframes, it has been a reliable signal the top is in.
The one catch, is that the reading must be above 0.25 to be effective in spotting the top. It’s also worth noting, that each top actually happened before the bearish crossover, which is why the MACD has a notorious reputation as a lagging indicator.
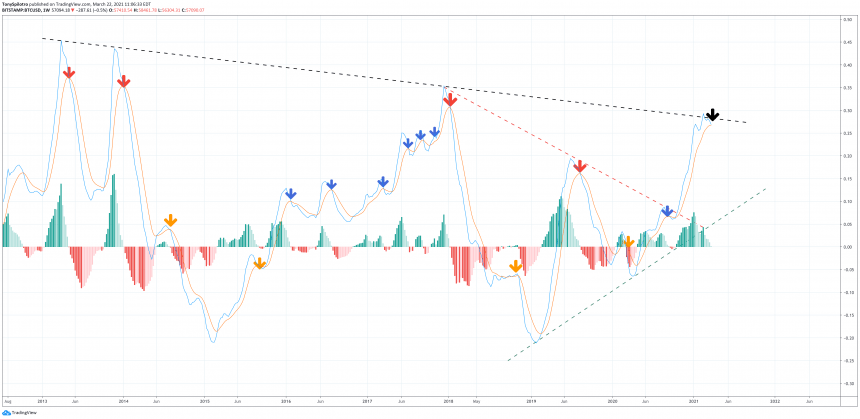
A more detailed look at the LMACD reveals a lot about price action | Source: BTCUSD on TradingView.com
Removing price action, and focusing on the details of the LMACD alone, tells an in-depth story about price action over the last several years.
Any red arrows marked a medium-to-long-term top. Each were above the key level of 0.25, and three out of four are brushing up a descending trendline, which the LMACD is currently touching now. Two out of those three were tops, but there’s no telling if the third time is the charm.
Arrows marked in orange also show yet another 50 to 70% collapse after the original 50 to 70% crash has concluded, but those were sweeps of bear market lows. Blue arrows are a lot more confusing, resulting in bearish crossovers and selloffs, but also an immediate resumption of the bull trend.
Related Reading | Following Bitcoin “Reset,” It’s “Off To The Races Again”
Which is what brings Bitcoin to an interest inflection point currently. The LMACD is, as mentioned, touching a trendline dating back nearly a decade worth of bull market tops, adding credence to any theories that the peak of this cycle could be in already.
But its worth mentioning also, that due to the several blue arrows, and the fact that Bitcoin already broke through one descending trendline (red dashed line) could suggest that this current run is going to break more than just price records.
Finally, although a top could be in for now, there’s no ruling out a 2013-like scenario where there were two distinct peaks only seven months apart. That would imply that any bearish crossover, would ultimately turn back up similar to 2017, but bring with it another peak just like 2013.
Featured image from Deposit Photos, Charts from TradingView.com


