Quick take:
- Litecoin’s halving in August 2019, was uneventful with LTC’s price failing to meet the expectations of fans and traders.
- LTC is frequently considered as Bitcoin’s little brother.
- Some analysts believe that first doing technical analysis on LTC could provide insights into Bitcoin’s future.
It is Easter Monday and the King of Crypto followed our previous analysis of holding the $6,600 support level. To note is that we did not expect that there might be a slight pump before the dump. It was self-evident through the 6-Hour MFI, that Bitcoin could attempt a retest of $7,200. However, as with all Technical Analysis, you cannot always ‘see everything’. In the meantime, and with the Bitcoin halving less than a month away, it might be time to consult Litecoin in determining the future of BTC in the coming days and weeks.
Litecoin’s Price Action Has on Some Occassions, Provided Clues as to What BTC Will Do Next
Popular Bitcoin analyst, Willy Woo, has on numerous occasions put forth the theory that LTC leads Bitcoin in price action. Numerous keen crypto trader’s, have in turn proved this theory to be valuable as a guide in determining Bitcoin’s next move in the crypto markets. One of Mr. Woo’s statements highlighting the theory can be found below.
LTC has a habit of leading BTC.
Shorters gonna be rekt (not from just this chart but from other fundamentals too). pic.twitter.com/v1JeeVyd1Q
— Willy Woo (@woonomic) April 7, 2020
Litecoin’s Price Action During Last Year’s LTC Halving
LTC underwent its own halving event on the 5th of August 2019. As a result, the price of Litecoin peaked around 22nd June 2019, at a value of $146. Immediately after that, Litecoin underwent a 6-month correction that saw the value of LTC drop to $35 before a relief rally early this year to a value of $84 around mid-February. The screenshot below provides a better visual cue of the situation then.
Could Bitcoin Follow a Similar Path
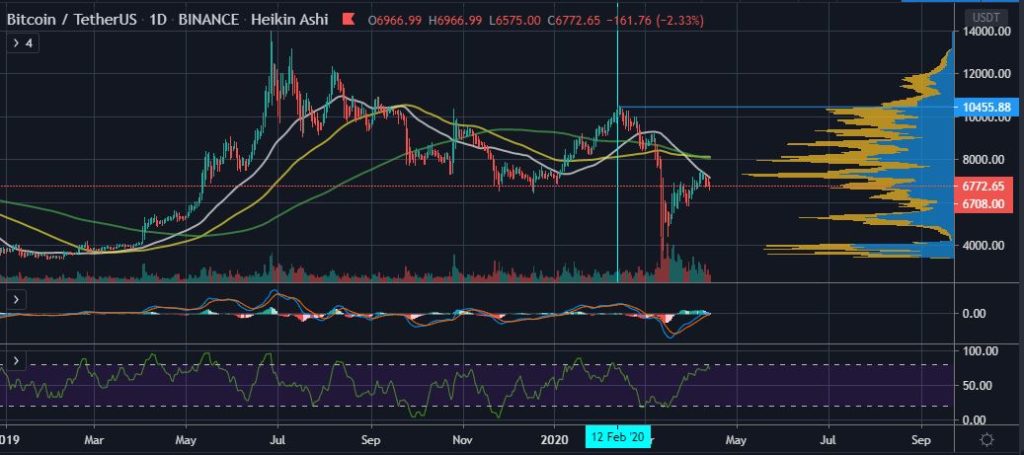
In our few analyses of Bitcoin this month, we have continually cautioned regarding a death cross on the daily chart. Further using the Litcoin model before the LTC halving, we can conclude that BTC experienced its own local top before halving around $10,500 in mid-February this year.

If we follow the Litecoin pattern from last year, Bitcoin might experience a 6-month bearish environment until mid-August. Further using the LTC top of $146 and bottom of $35 in December 2019 to create a crude predictive ratio (146/35), we can estimate that BTC should find a bottom around the $2,500 area using the top of $10,500. This is in line with an earlier analysis by @MagicPoopCannon who has also predicted a Bitcoin bottom between $2,500 and $1,200.
(Feature image courtesy of Tomasz Frankowski on Unsplash.)
Disclaimer: This article is not meant to give financial advice. Any additional opinion herein is purely the author’s and does not represent the opinion of Ethereum World News or any of its other writers. Please carry out your own research before investing in any of the numerous cryptocurrencies available. Thank you.


