In this third installment of my Bitcoin Price Diary, I’ll revisit some open positions which are still in play and review a sizable trade on REN. I also have a position in Bitcoin (BTC) that is still largely open.
As I have said a number of times on Twitter, I believe that it has been an altcoin season for months and that altcoins found their local bottoms in August. I have been comfortably trading them since. In early October, Bitcoin dropped and was ranging sideways, giving altcoins even more room to appreciate.
At the time of writing, Bitcoin price is a few days removed from a sizable 6.6% move up, which caused a drop across the board on many altcoins. I am proceeding with caution on altcoins for the moment until Bitcoin has provided clearer direction for its next move.
I prefer to keep my active trades at a minimum because it helps me manage my risk. Opening multiple altcoin positions at the same time rarely works for me as they move in tandem based on Bitcoin price moves.
This is why I assign a 1% risk for multiple positions as failing to do this can lead to sizable loss across the board. I prefer to identify the 1 or 2 setups I like the best and allocate more funds to heavier positions. In this case, I deployed the bulk of my trading capital into a REN position, which worked out beautifully.
Let’s take a look at some charts to see how the process worked out.
REN/BTC: Setting up the trade
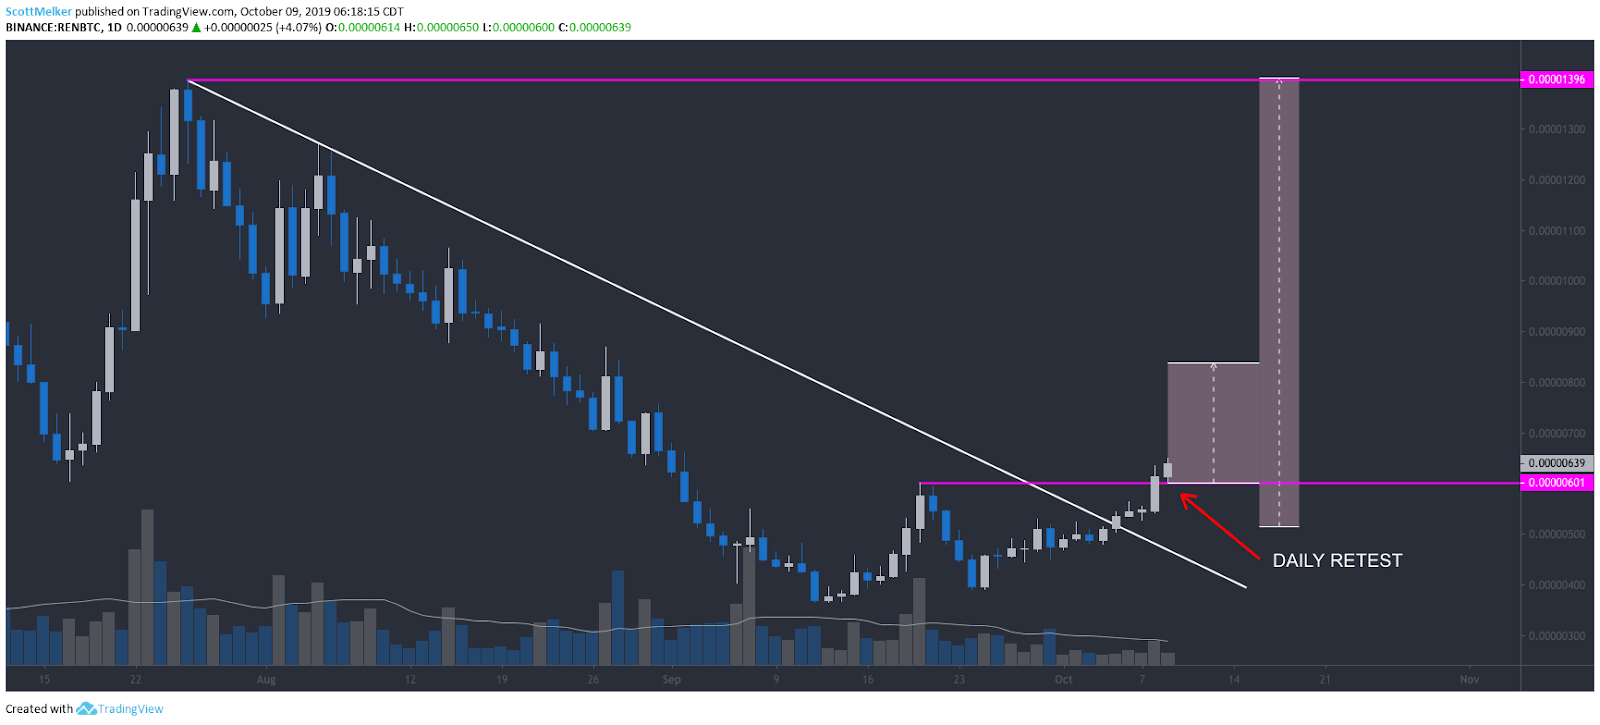
Entries: .00000512 (sats), .00000601 (sats)
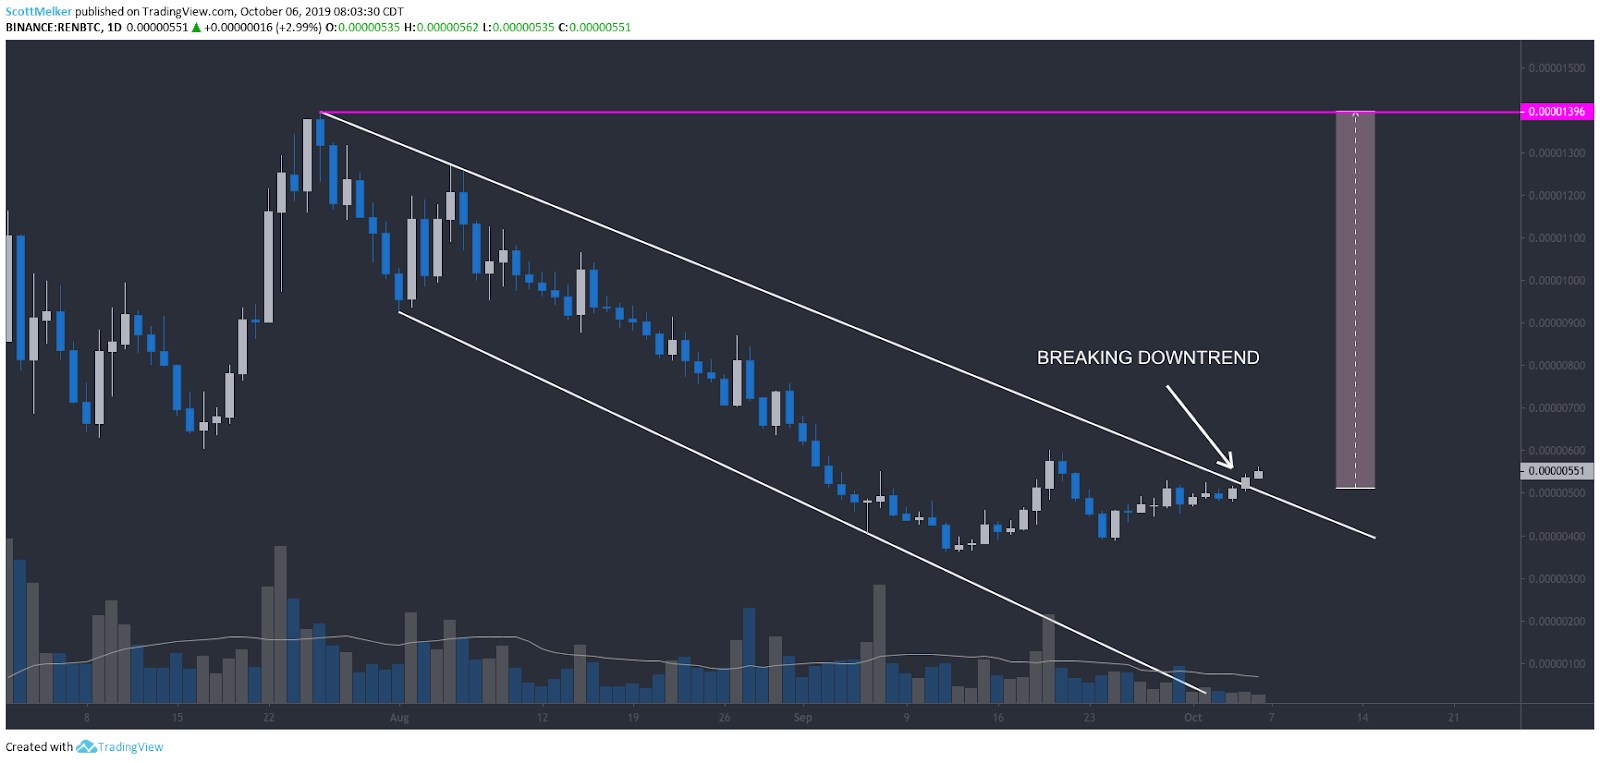
Targets: The target of the initial breakout, for me, is a trip to the all-time high. This is ambitious, but my first target for a small portion of the trade was set at .00001396 (sats). This would be a 170% gain.
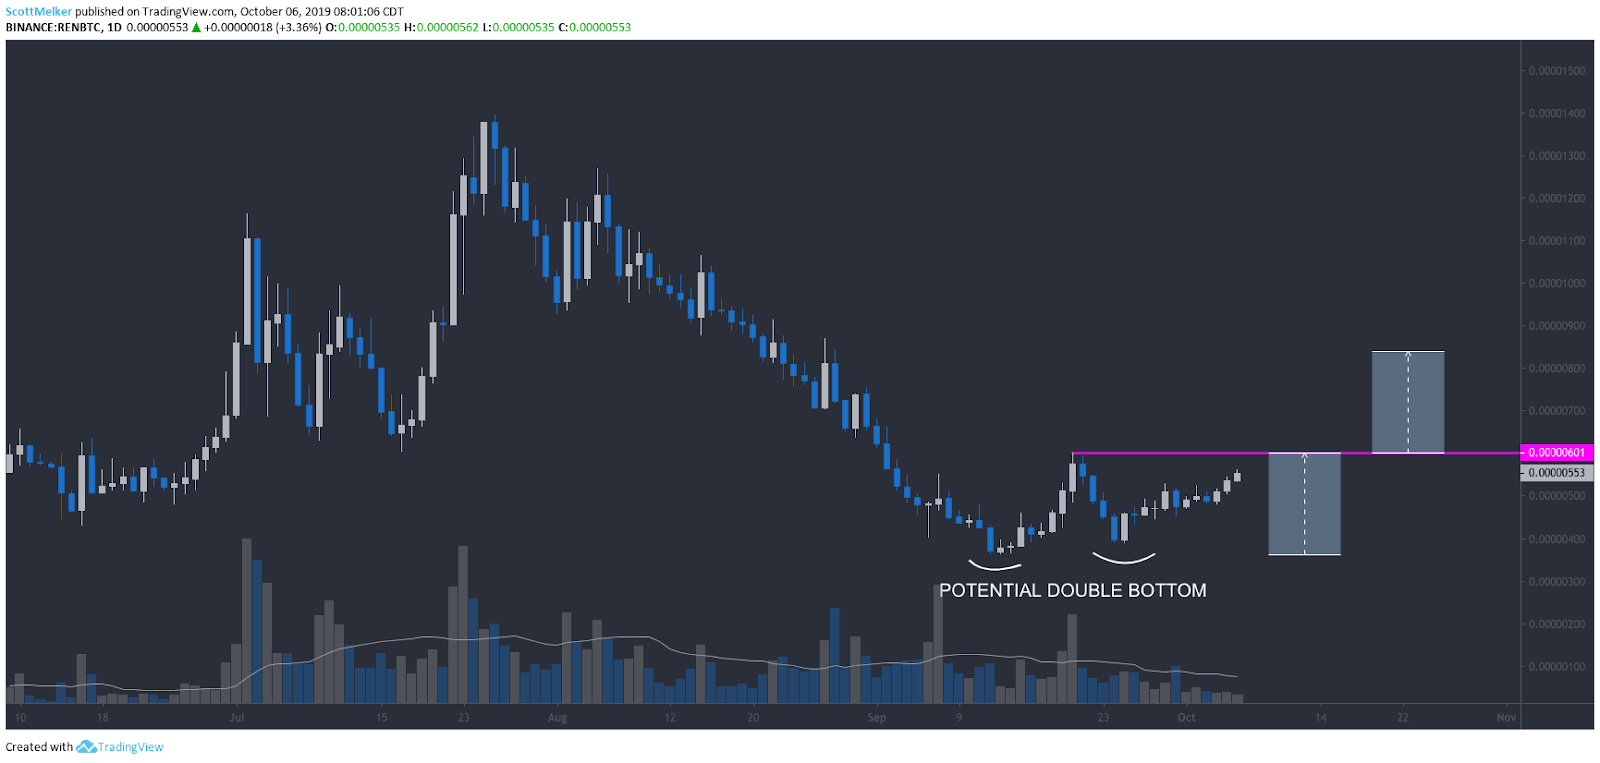
At the time of entry, I was watching for a potential double bottom (confirmed with a break of .00000601), with a target around .00000840. This would be a 64% gain from the first entry and a 40% gain from the second entry.
Stop loss: In case the trade goes belly up I’ve placed a stop loss at .00000476 (sats), which equates to a 7% loss on the trade.
Calculating the risk-reward ratio
It’s also good practice to consider the risk to reward ratio when making an investment, especially with altcoins given Bitcoin’s current dominance rate.
The risk to reward ratio measures the difference between a trade’s entry point all the way to the stop-loss and sell or take-profit order.
Comparing these two provides the ratio of profit to loss, or reward to risk. For this trade, it is roughly 26 (!!!) at the first target and 9.6 at the second target.
General analysis
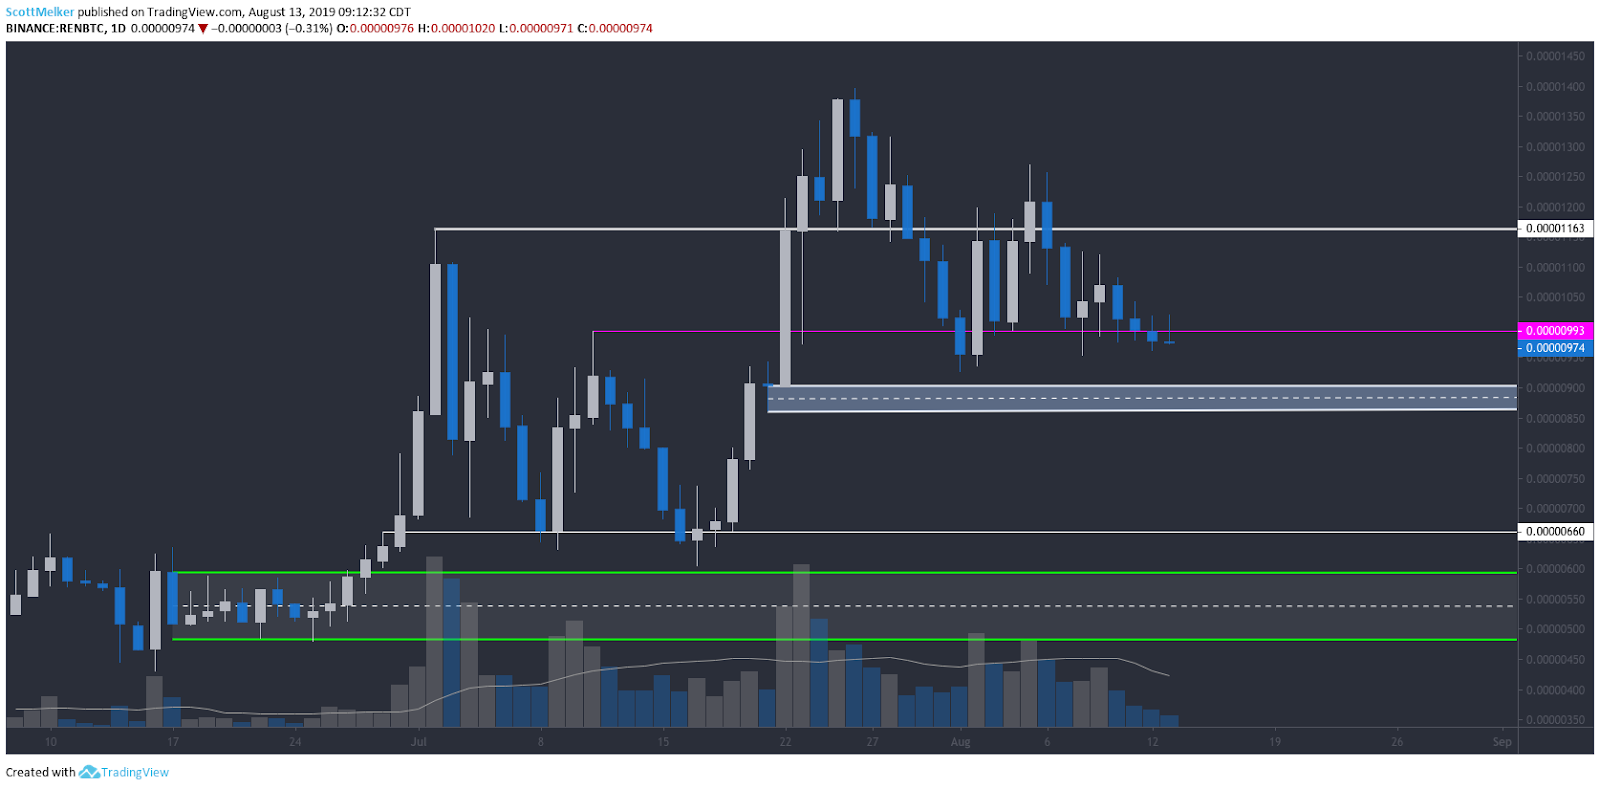
REN has been in a clear and sustained downtrend since hitting its all-time high in July. I caught most of the move up and was able to profit, exiting near the top. I had very little interest in trading it again, and consistently posted on twitter why I viewed more downside as likely.
As previously mentioned on twitter I believe the down move began with a head and shoulders and daily bear div.
Price ultimately fell well below this area into the .00000360 zone.REN/BTC 4-hour chart. Source: TradingView
I clearly targeted the low 0.000005 area, as can be seen by my consistent posting about the green weekly demand zone on my old charts.
REN/BTC daily chart. Source: TradingView
Entry ideas
The white descending line on the daily chart was my main area of interest for an entry. I viewed this as a clear break of the sustained downtrend. REN/BTC price broke through this line on Oct. 5, where I entered my first trade on the breakout at .00000512 sats.
REN/BTC daily chart. Source: TradingView
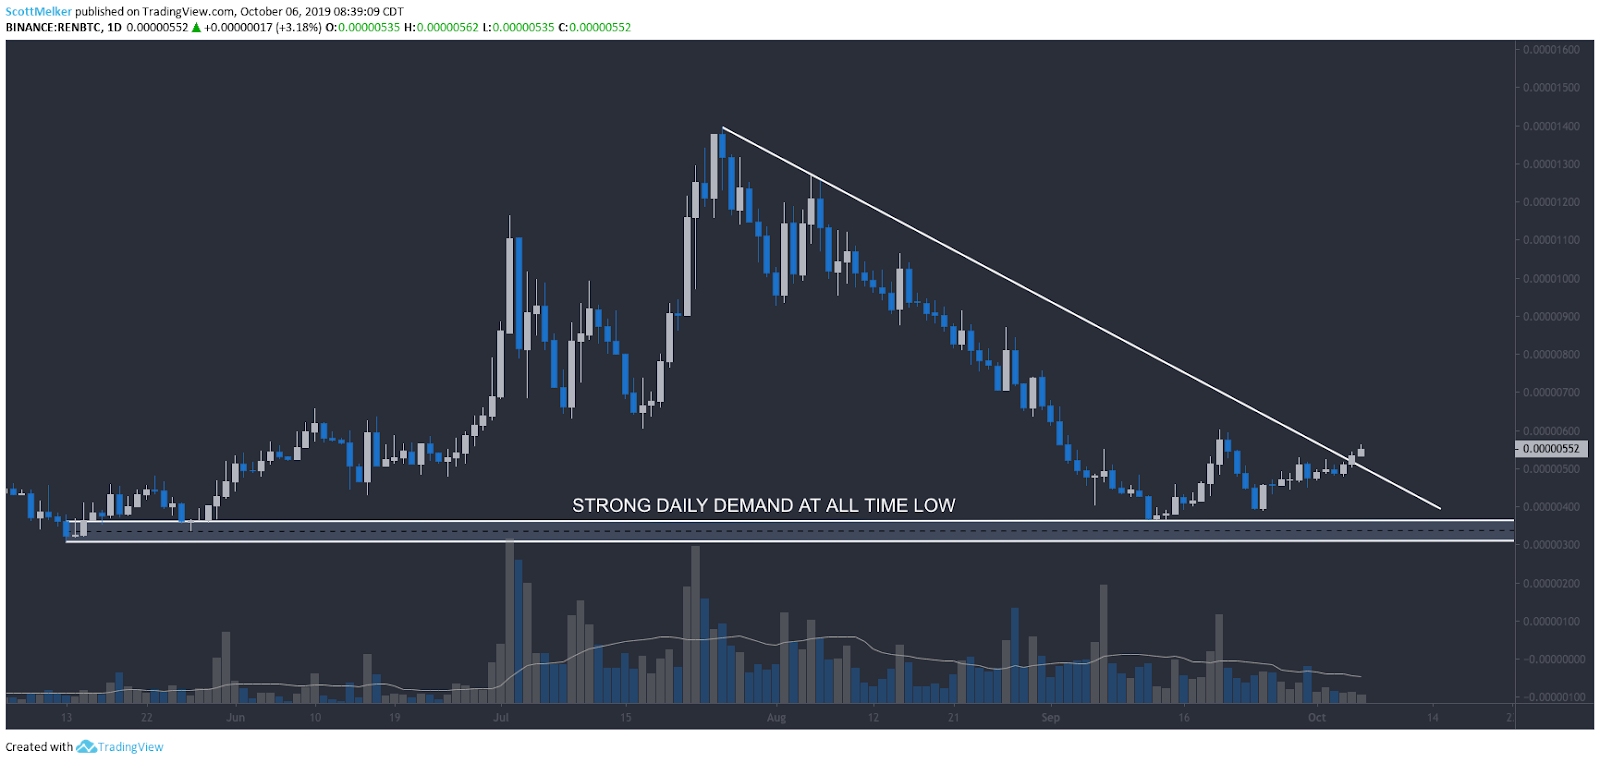
Previously, REN price bounced out of a strong demand area (seen on the chart below) on the daily chart, formed above the all-time low of .00000309 on Binance.
The move up from there caught my attention, and would be viewed as a potential entry for traders with a higher risk profile. I was still not interested in trading the coin without confirmation of a reversal to the upside — a break of the descending line.
REN/BTC daily chart. Source: TradingView
Price also formed a potential double bottom at .00000388 sats, which gave me another area of interest for an entry.
A double bottom is confirmed when the neckline (the highest swing point between the two bottoms) is broken. I love trading a retest of this line, so I added to my position at .00000601 sats.
REN/BTC daily chart. Source: TradingView
REN/BTC daily chart. Source: TradingView
How it worked out
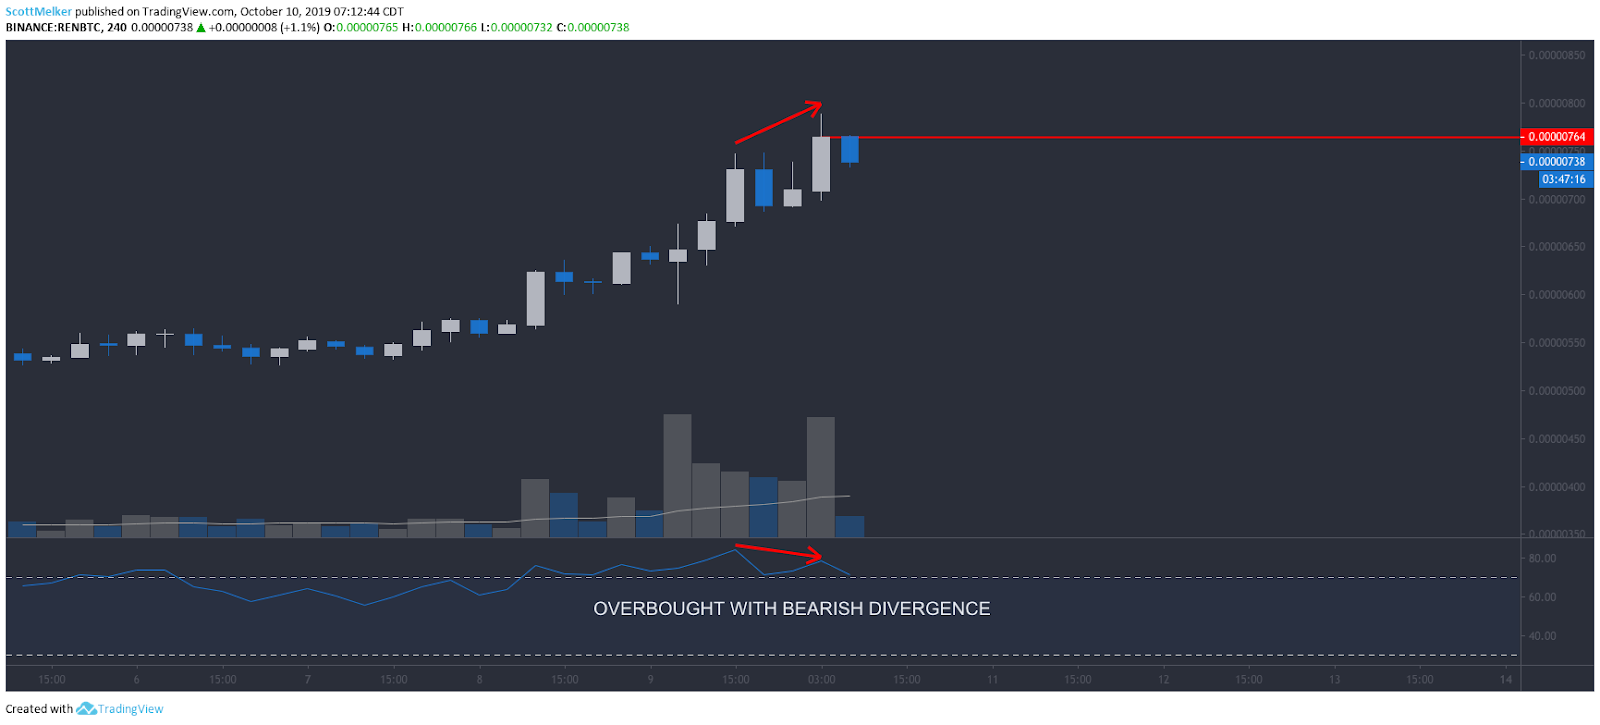
I exited early on 75% of the position at .00000764 sats, for a profit of 49% on the first entry and 27% on the second entry.
Why did I exit early? There are a few reasons.
Bitcoin made a sizable move to the upside, causing a drop in most altcoins. I believe there is more upside eventually in store for Bitcoin, so this could cause further price depreciation in REN/BTC.
More importantly, I identified a clear bearish divergence on the Relative Strength Index (RSI) on the 4-hour chart, with RSI overbought. A majority of the time, this signals a local top, if not an end to the entire move up.
REN/BTC daily chart. Source: TradingView
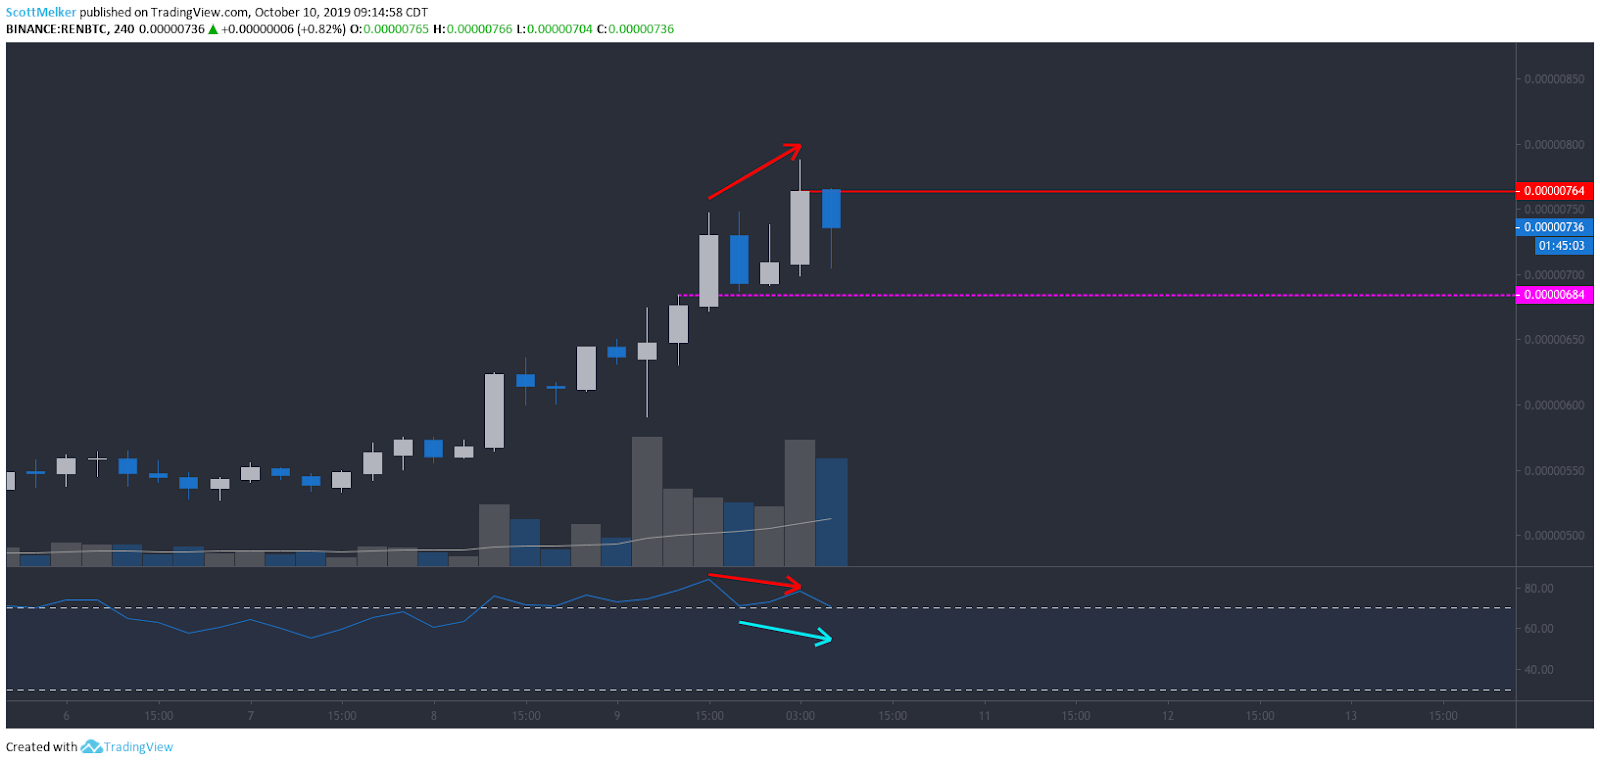
I have moved up the stop loss on the rest of my position to just below the pink line at .00000684 sats. There is a potential hidden bullish divergence forming, which would be invalidated at that point. Further, that line is a clear area of support that bulls would like to see hold.
REN/BTC 4 hour chart. Source: TradingView
BTC/USD
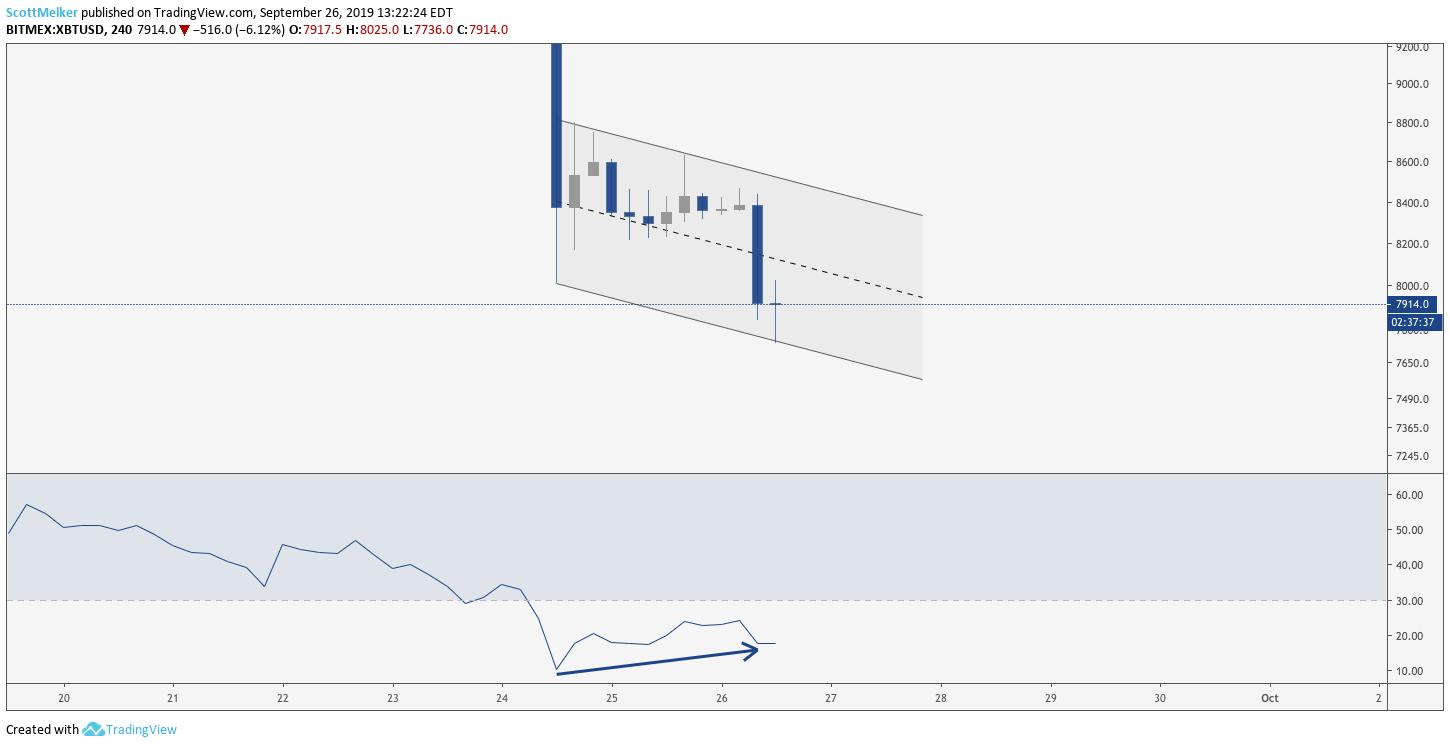
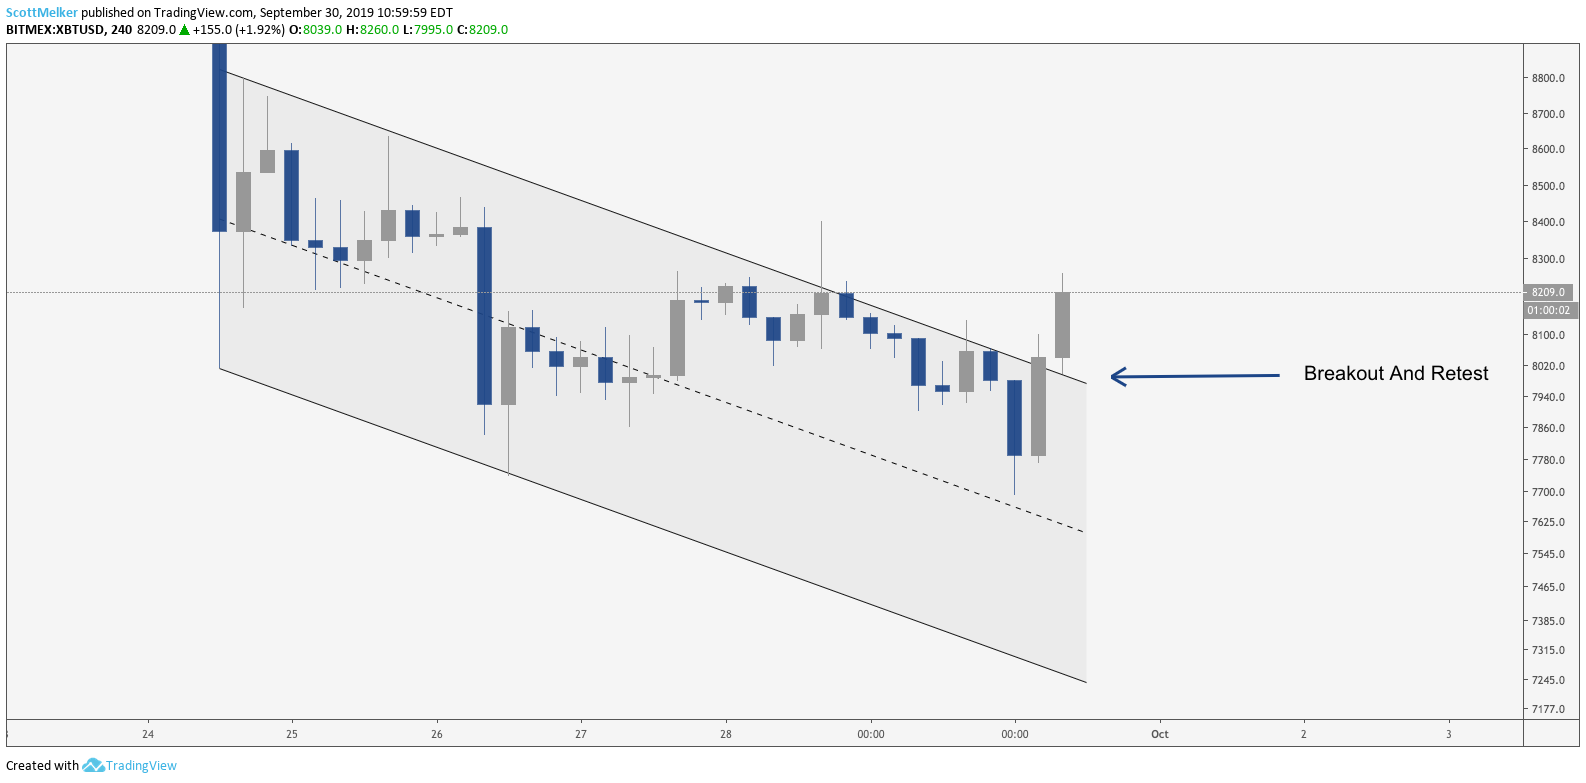
I took a swing position in Bitcoin, i.e. BTC/USD (XBT/USD) on Sept. 26 at $7,914, re-entering the market with a large chunk of the fiat that I had on the sideline. The premise for the trade was that I saw a nice 4-hour candle with a large wick down, which made a clear descending channel.
This candle was shaping up to be a nice reversal. Combined with the descending channel and the significant bullish divergence with the RSI, I was confident that price would rise. The RSI was historically low on the first drop, hitting 4.38. A bounce was somewhat inevitable.
XBT/USD 4 hour chart. Source: TradingView
Bitcoin price made a move above the equilibrium (dashed centerline) of that channel, and broke out, bullishly retesting resistance as support.
XBT/USD 4 hour chart. Source: TradingView
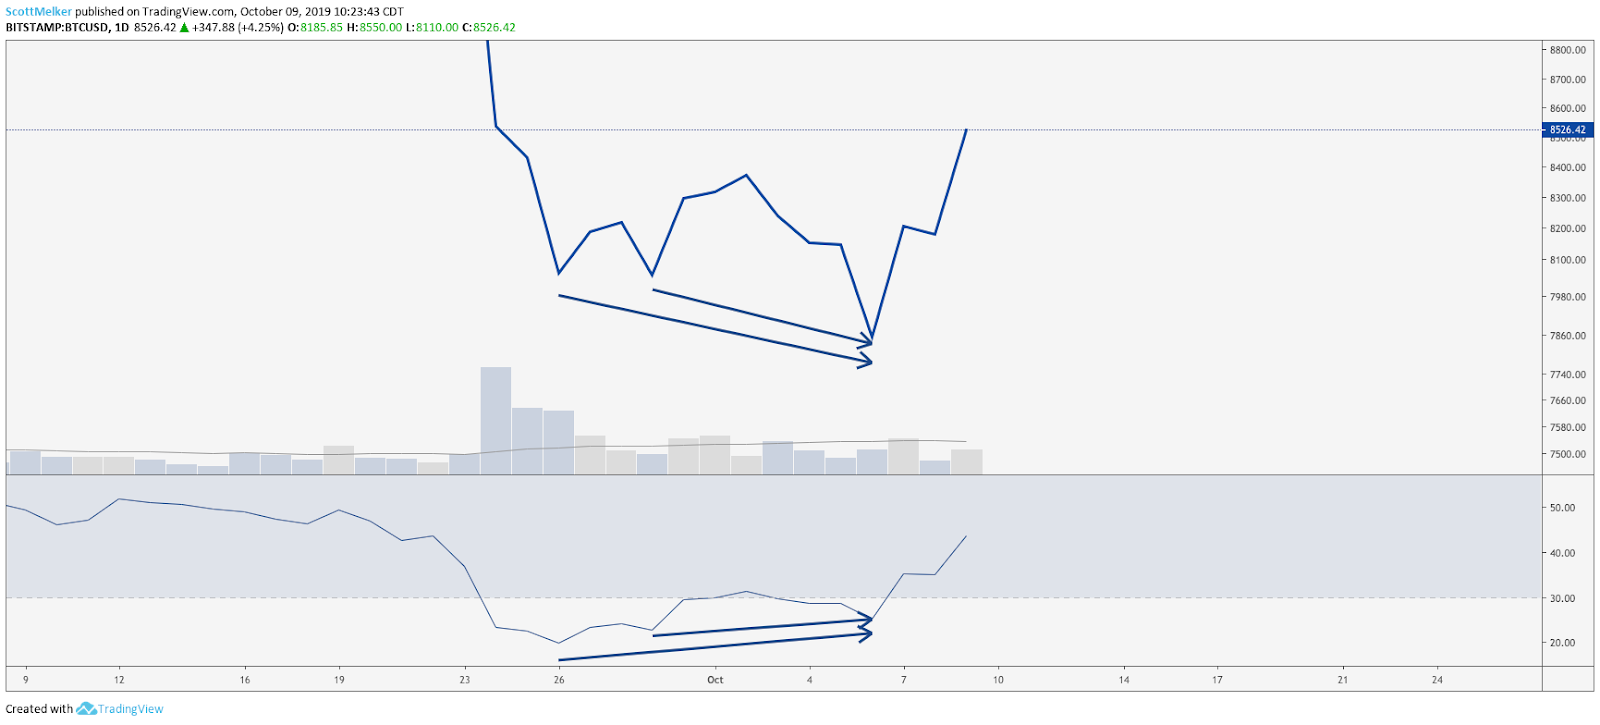
Although price dropped once more, I did not exit the trade, because I saw another bullish divergence with RSI forming on the daily chart.
BTC/USD daily chart. Source: TradingView
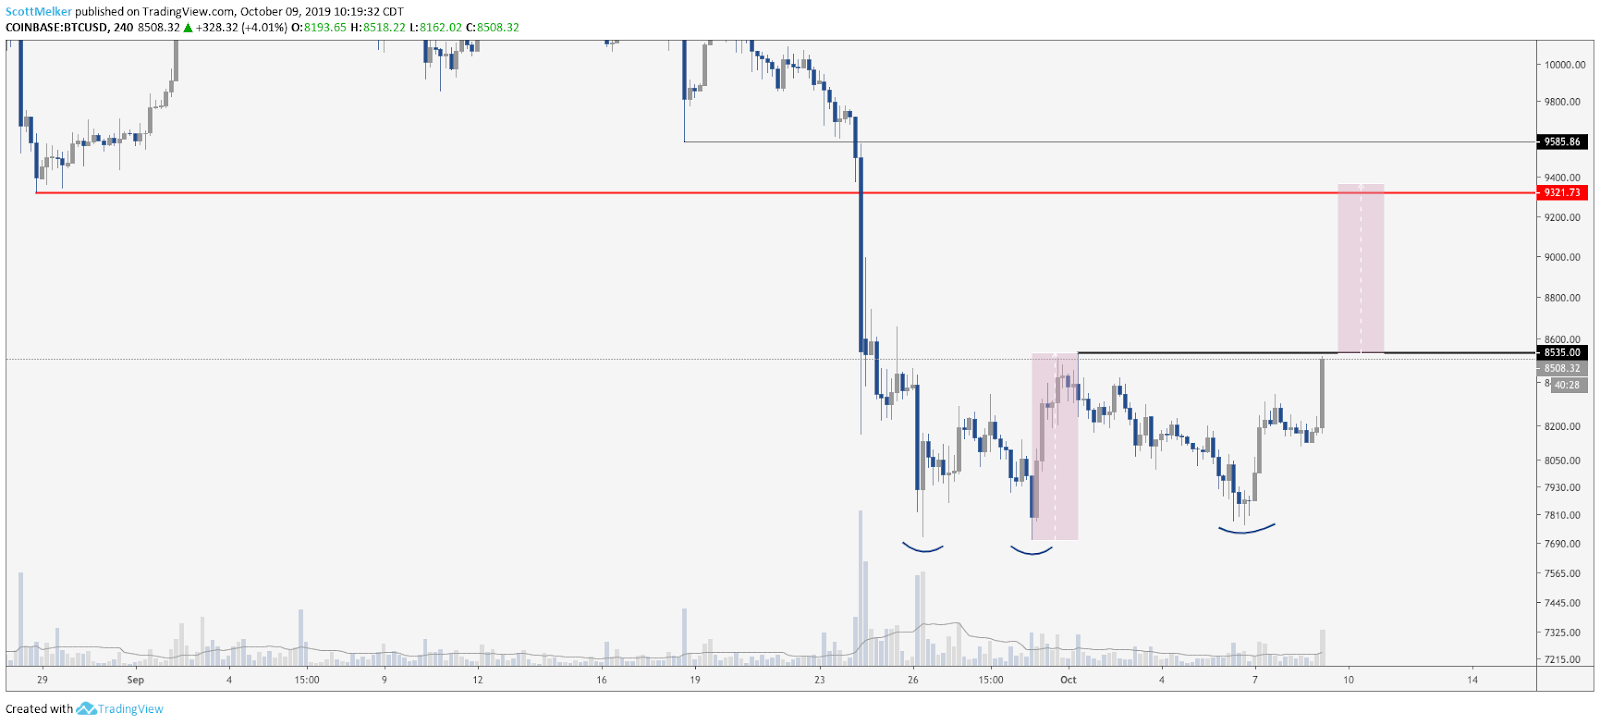
This led to the large move up from around $7,700 to over $8,500. I exited 50% of the trade at $8,625, and am still holding the remainder of the position as price confirmed a triple bottom on the 4-hour chart when it broke $8,535 — the swing high between the three bottoms. It successfully retested this area, so further price appreciation is likely. I will keep you updated!
BTC/USD 4 hour chart. Source: TradingView
The views and opinions expressed here are solely those of the (@scottmelker) and do not necessarily reflect the views of Cointelegraph. Every investment and trading move involves risk. You should conduct your own research when making a decision.
Market data is provided by HitBTC exchange.


