- Previous market melt-ups have had higher daily volatility.
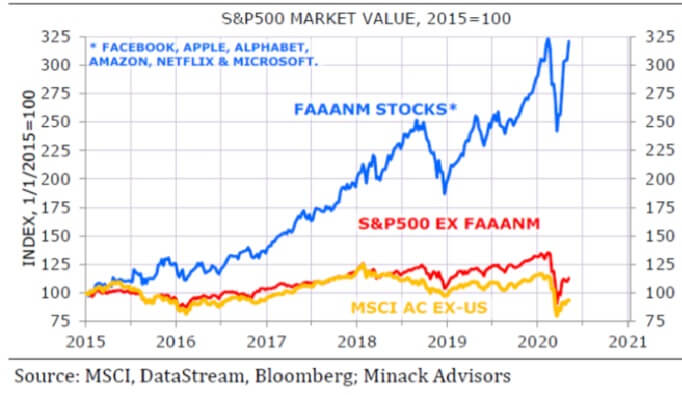
- However, as in the 1960s, only a few stocks are driving the market.
- It’s still a dangerous time for investors.
With interest rates at record lows, stocks look like the best game in town. That’s led some to ask: Are we even in a bubble?
Bubbles and Volatility
When investors think of bubbles, they think in terms of radical changes in valuation from when that bubble bursts. However, when a bubble is expanding, there’s a growing trend of investors getting onto one side of a trade—usually the long side.
Sometimes, that looks like the investors who piled into Apple or Tesla Motors ahead of their share splits earlier this year. Other times, there’s a gradual rise in markets during a melt-up.
With an average daily return on the S&P 500 of 0.04% in the past five years, this market has had a slower rally than during the epic 1990s tech bubble or the 1920s postwar euphoria run.
Lower volatility implies that investors shouldn’t be worried about a bubble today. But the 1920s run precipitated the greatest stock market selloff of all time. By the bottom in 1932, the stock market as a whole had declined about 89%. The tech bubble cost the Nasdaq over half, and it wasn’t until 2015 before that index made a post-2000 high.
FAANG is the New Nifty Fifty
The real issue with today’s low volatility is that most of the market’s returns are found in just a handful of big tech stocks. The FANG acronym was expanded to FAANG—but either way, those five stocks alone have come to dominate the market index as a whole. Six if you include Microsoft.

That means that 495 companies in the S&P 500 can perform however they want without really impacting the index. With many of those companies still down for the year or even poor performers on a multi-year basis, it’s easy to see why the market can move but with low volatility.
Historically, this also occurred in the 1960s. In the first real bull market since the Great Depression, investors piled into high-growth names, eventually building concentrated portfolios around high-flying tech companies of the era like IBM, Polaroid, and Xerox.
This portfolio was dubbed the “Nifty Fifty.” Investors didn’t think about which of these stocks to own so much as how many shares of each company to own. Eventually, the market would face a 36% drop between 1968 and 1970.
The bottom line is that low volatility isn’t the best measure for a market bubble. The ability to move a stock market—up or down—with just a handful of names is a concern. It means you don’t need the entire market involved to have a bubble. Today, only a few companies can make substantial moves.
Investors should remain concerned with bubble-like valuations. Even corporate officers do. That doesn’t mean a market crash is ahead, but it does mean investors should wait for a selloff for better values.
Disclaimer: This article represents the author’s opinion and should not be considered investment or trading advice from CCN.com. Unless otherwise noted, the author has no position in any of the securities mentioned.


