Long-time Bitcoin (BTC) HODLers are refraining from selling their holdings, on-chain data from Glassnode shows.
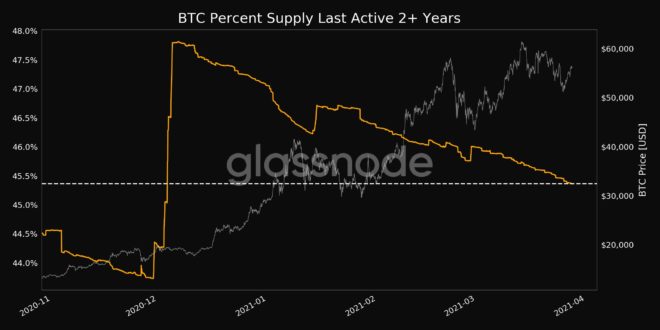
According to Glassnode’s “BTC Percent Supply Last Active 2+ Years” indicator, Bitcoin that was last moved well over two years ago reached a three-month low to 45.364%.
This trend indicates that Bitcoin HODLers who bought around the top of the last bull cycle in 2018 and before are showing deeper conviction as BTC consolidates above $55,000. Interestingly, the spike during December 2020 suggests that many may have sold at a breakeven of around $20,000, or the previous all-time high in late 2017.
Why is Bitcoin consolidating with low volatility bullish?
Bitcoin typically tops or sees a severe correction when long-time holders begin to sell rapidly.
In previous bull cycles, the sell-off from HODLers taking profit on their positions led to swift 50% drops, leading the entire cryptocurrency market to pullback intensely within short periods.
This trend coincides with the fact that HODLers are not selling a significant amount of BTC, indicating that the top could still be faraway from being reached.
Bitcoin stabilizing at around $55,000 is highly optimistic because of two main reasons. First, BTC has maintained a strong market structure despite some headwinds. Second, BTC consolidating closely under an all-time high is technically a positive sign.
In the past two weeks, Bitcoin faced major threats that could have catalyzed a serious short-term downturn.
Namely, the U.S. Treasury yields surged. This often causes tech stocks to drop-off, which negatively affects all risk-on markets.
Atop this, as CryptoQuant CEO Ki Young Ju explained, miners are holding a lot of Bitcoin that they have not sold in recent months. In fact, the amount of BTC moved by miners was significantly less compared to previous pullbacks this year. This may suggest that miners are likely expecting higher prices down the road.

On March 17, Ki also noted three other factors based on on-chain trends that could contribute to a stagnating uptrend for Bitcoin. He wrote at the time:
“I think $BTC would take some time to get another leg up in terms of demand/supply. 1/ Too many $BTC holdings in USD compare to stablecoin holdings on spot exchanges. 2/ BTC market cap is too big to get another leg up by leveraging stablecoin market cap solely. No significant USD spot inflows – Neutral coinbase premium, and negative GBTC, QBTC premium.”
Despite the above-mentioned risks, Bitcoin has performed relatively well, avoiding a drop below $50,000.
Is the BTC bottom in?
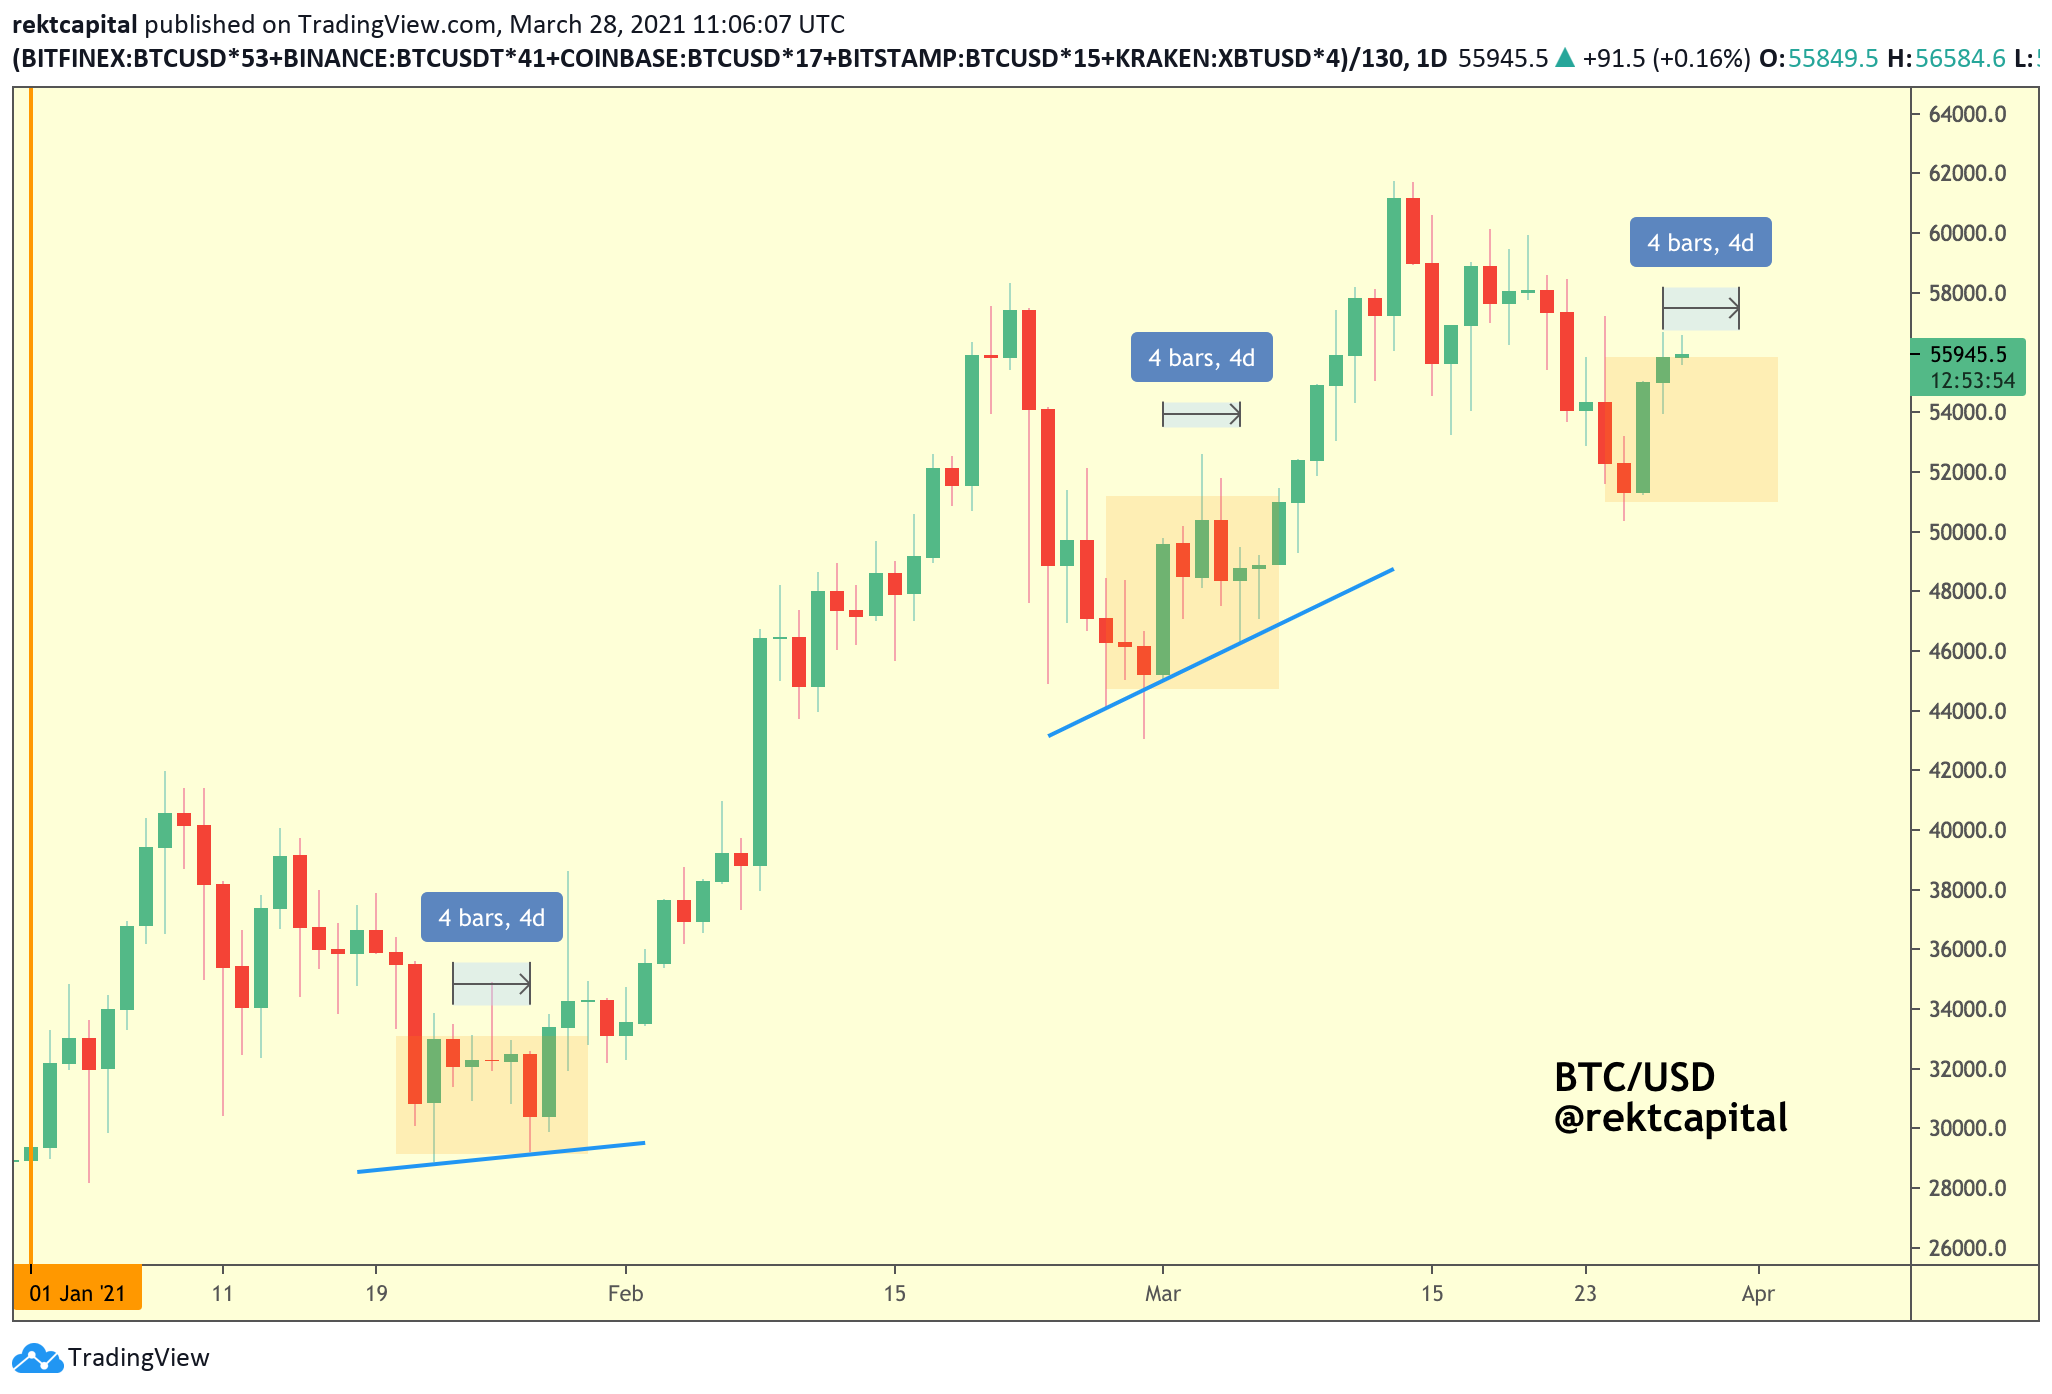
Well-known pseudonymous traders, including “Rekt Capital,” have said that in the next couple days, there could be sufficient confirmation that a Bitcoin bottom could form.

It is difficult to predict when the exact bottom would form, but if BTC remains above $55,000 for a few days and prints a “higher low” formation, the trader said a new rally could occur. He wrote:
“You will never truly know when the actual #BTC bottom of the retrace is But you can look for ways for how a potential bottom could be confirmed If $BTC forms a Higher Low in the next couple of days, that should be sufficient confirmation that the bottom is in.”
Therefore, as long as the price of Bitcoin holds above $55,000 in the near term, the higher low formation would be intact as the market enters April, a historically bullish month that hasn’t closed in the red since 2015.


