The price of Bitcoin (BTC) closed the second week of December at $7,111, down 5.44% for the week with five of the seven days being days of decline. So far on Monday, Bitcoin is trading down around 0.8% and currently holding above the $7K handle at $7,055.
Bitcoin dominance remained flat throughout last week and remains at around 66.5% of the total cryptocurrency market cap of $193 billion, illustrating that all other majors followed Bitcoin to the downside over the last 7 days.
With Bitcoin finding its terminal lows for 2018 exactly 365 days ago, we will explore how Bitcoin is looking one year on, up almost 120% on the previous year.
Cryptocurrency market 7-day view. Source: Coin360
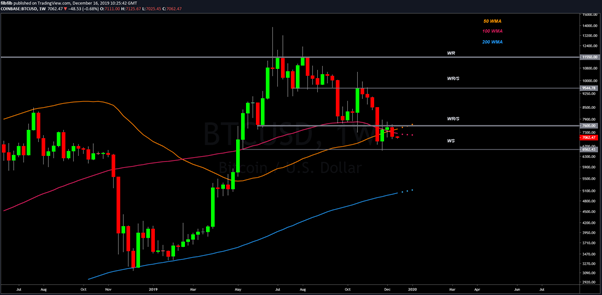
Weekly chart
BTC USD Weekly chart. Source: TradingView
Chart Structure / Support / Resistance -2: Bearish
- There is a clear 24-week downtrend which began in July — bearish
- Multi-week support of $7,600 was lost four weeks ago and has now turned into resistance for three weeks — bearish
- Bitcoin has found initially strong support at an old support level of $6,400, which bounced 20%; however, the price has been in decline since — neutral
Key Moving Averages +1: Bullish
- The 50/100 week moving averages are crossed bullish, which has previously prompted long term sustained upward moves for Bitcoin price — bullish
- Price is trading below the bullish cross and finding resistance in both the 50 and 100 Week Moving average — bearish
- Bitcoin is trading above the 200-week moving average, which is also trending higher — bullish
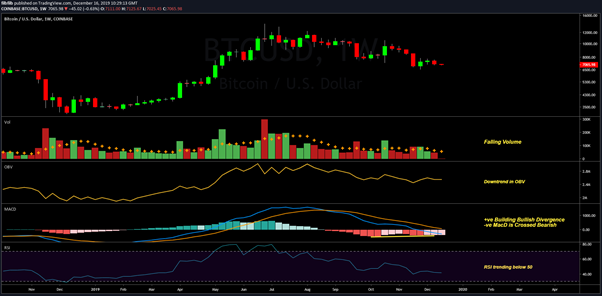
BTC USD Weekly chart. Source: TradingView
Moving Average Convergence Divergence (MACD) -1: Bearish
- The MACD is below zero meaning that the exponential moving average (EMA) of the 12 and 26 are crossed bearish — bearish
- There are higher lows on the histogram that is in deviation to lower lows in price, which is considered bullish divergence; but this is unconfirmed until there is a bullish cross on the MACD meaning it is relatively positive, but overall neutral
Relative Strength Index (RSI) -1: Bearish
- The RSI, a momentum indicator, is trending below 50 — bearish
- The trend appears to be weakening to the downside but is too early to call bullish — neutral
Volume and On-Balance Volume (OBV) +1
- Volume has been decreasing since June — in a downtrend, this is typically viewed as bullish
- OBV has flattened out, illustrating that cumulative volume to the downside is losing momentum but currently no bullish divergences or breaks to the upside — neutral
Weekly Conclusion -2: Bearish
Overall, Bitcoin is up a significant amount year-on-year and, as such, it is not a surprise that long view moving averages are crossed bullish. Nevertheless, the momentum indicators in the RSI and MACD, which look at more recent price action, illustrate that momentum remains to the downside although it is starting to show signs of weakness. This weakening bearish momentum is also reflected in the declining volume.
Overall, the weekly chart is conclusively bearish until there is a breakout in volume and a shift in price direction.
Daily chart
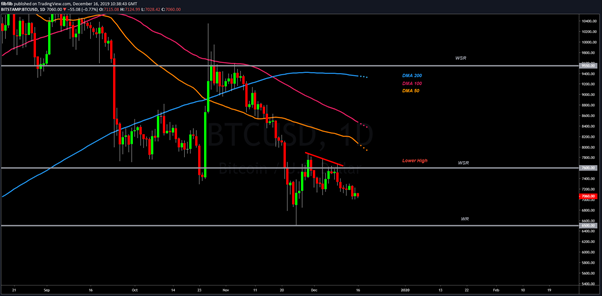
BTC USD Daily chart. Source: TradingView
Chart Structure / Support / Resistance -2: Bearish
- Bitcoin enjoyed a strong 20% local bounce off support at $6400, which retested previous support — bullish
- The retest of the $7,600 level resulted in a false breakout across resistance (formerly support) — bearish
- Since the false breakout, Bitcoin has been consistently recording lower highs and M-top pattern — bearish
Key Moving Averages -3: Bearish
- All key daily moving averages are trending down — bearish
- Price has been trading below all three key moving averages — bearish
- The death cross of the 50-200 DMA currently shows no sign of reversal — bearish
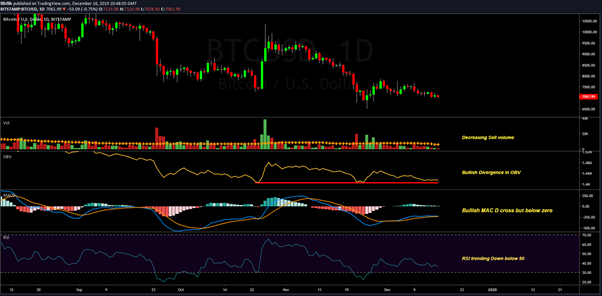
BTC USD Daily chart. Source: TradingView
Moving Average Convergence Divergence (MACD) 0: Neutral
- MACD is below zero meaning that the EMA of the 12 and 26 are crossed bearish — bearish
- The MACD is crossed bullish with its signal line but is showing some signs of momentum slowing down so remains only marginally bullish
Relative Strength Index (RSI) -1: Bearish
- RSI is trending below 50 — bearish
- The trend remains to the downside — bearish
Volume and On-Balance Volume (OBV) +1: Bullish
- As pointed out with the weekly chart, volume continues to decline in a downtrend and considered bullish
- There is a bullish divergence on the OBV where it is recording higher lows while the price is recording lower lows; this is relatively rare — bullish
- OBV trend Remains down — bearish
Daily Conclusion -5: Bearish
Overall, the daily chart is unsurprisingly more bearish given the recent price action with a relief bounce off support within a downtrend. On a daily time frame, Bitcoin is starting to show some signs that the downtrend is weakened, particularly in volume, though without a clear immediate sign of reversal.
4-hour chart
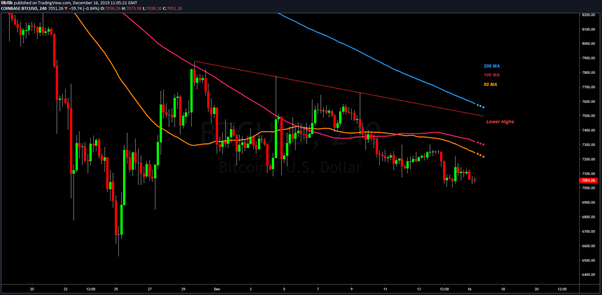
BTC USD 4 Hour chart. Source: TradingView
Chart Structure / Support / Resistance -2: Bearish
- Sustained decline with rejection wicks since the failure at $7,250 — bearish
- Sustained lower highs and lower lows — bearish
Key Moving Averages -2: Bearish
- All key moving averages pointing to the downside — bearish
- Price below all key averages — bearish
- Forming a base above the previous area of clear demand in the $6,000s — bullish
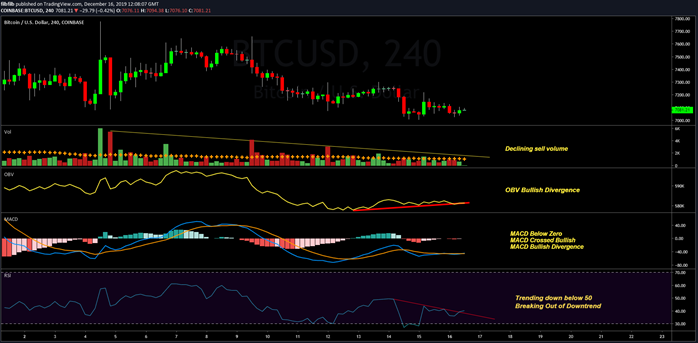
BTC USD 4 Hour chart. Source: TradingView
Moving Average Convergence Divergence (MACD) +2: Bullish
- MACD is below zero — bearish
- MACD crossed bullish with its signal line — bullish
- MACD has bullish divergence on both the histogram across three periods and the MACD line itself — bullish
Relative Strength Index (RSI) -2: Bearish
- RSI is trending below 50 — bearish
- Trend remains to the downside after a bounce from oversold conditions — bearish
Volume and On-Balance Volume (OBV) +3: Bullish
- Local volume decreasing from the rejection at $7,600 into area of demand — bullish
- There was a bullish divergence in the OBV where the it is recording higher lows while price is recording lower lows — bullish
- OBV attempting to resolve trend overall to the upside — bullish
4-hour conclusion -1: Bearish
The 4-hour chart shows that there may be a good chance of Bitcoin recovering some ground early in the week. This would also fit with narrative around the CME gap at $7,240 needing to be filled after the weekend.
6-month downtrend remains but bears losing steam
Overall, tallying up the total scores for each section we get negative 16 (where a negative number is bearish and a positive number implies bullish sentiment). This suggests that Bitcoin remains overwhelmingly in a local downtrend defined by the last 6 months.
There are early signs of the bears running out of steam across all timeframes, which is mainly due to the declining volume and approaching areas of previous buying interest. With the 2018 bottom being 365 days ago, a similar narrative was being pushed at the time and it was not until a few months later that a bottom would be confirmed.
With five months to go until the halving, buyers may look to accumulate around these levels and the first signs will be visible in the volume, coupled with sideways price action, which is what speculators should be focused on attempting to identify in the interim period as the downward trending price structure will take some time to resolve.
The views and opinions expressed here are solely those of the author and do not necessarily reflect the views of Cointelegraph. Every investment and trading move involves risk. You should conduct your own research when making a decision.


