View
- Bitcoin’s broader uptrend is still valid despite Monday’s sudden move lower from $10,200. The weekly chart shows scope for a test of the October high of $10,350.
- A deeper pullback to support below $9,600 may be seen before the return of the rally, as the short duration charts are indicating buyer exhaustion.
- A UTC close under $9,075 (Feb. 4 high) would invalidate the bullish setup.
Bitcoin’s broader bullish trend is intact despite Monday’s sharp retreat from a 3.5-month high over $10,000.
The cryptocurrency ran into offers near $10,200 and fell to levels near $9,730 during the Asian trading hours on Monday and spent the rest of the day trading in the narrow range of $9,750–$9,900.
Prices closed Monday (UTC) with a 3.18 percent loss, the second-largest daily decline of 2020 – the first being a 3.2 percent slide seen on Jan. 23, according to CoinDesk’s Bitcoin Price Index.
Some observers are disappointed that bitcoin’s break above $10,000 was so short-lived. “Disheartening to see BTC reject us not even 24 hours after breaking 10K,” derivatives trader John Wick tweeted earlier on Tuesday.
According to Wick, the speed of bitcoin’s ascent (or bullish momentum) has slowed. After all, Monday’s drop completely engulfed the price gains seen on Sunday – a sign of buyer exhaustion.
However, the broader uptrend from January lows below $7,000 is still intact, as prices are hovering well above the base (higher low) of $9,075, established on Feb. 4.
As long as that support stays intact, the path of least resistance will remain to the higher side. At press time, bitcoin is trading near $9,796, representing a 0.58 percent drop on a 24-hour basis.
Daily chart
Bitcoin has carved out a bearish engulfing pattern, marking a negative follow-through to Sunday’s bullish “marubozu” candle.
A failed marubozu at multi-month highs often paves the way for deeper price pullbacks.
Hourly chart

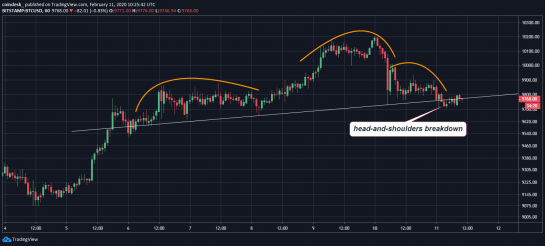
Bitcoin breached the head-and-shoulders neckline support during the Asian trading hours Tuesday. So far, the downside has been contained near $9,700.
The breakdown, however, could yet encourage selling and lead to a stronger move to the downside. The cryptocurrency looks set to revisit former hurdle-turned-support at $9,586 (Nov. 4 high) in the short term. Acceptance below that level would expose the Feb. 4 low of $9,075.
The immediate bullish case would be revived if prices rise above $10,010, invaliding the lower-highs setup on the hourly charts, as discussed yesterday.
Building a base?
It’s worth noting that corrections are a normal occurrence in bull markets and often end up recharging engines for the next leg higher. “If I was climbing a rock wall I would want to constantly re-anchor. Its same idea with assets, they build a base,” popular trader Cantering Clark tweeted Monday.
For instance, bitcoin fell from $9,188 on Jan. 19 and revisited the former hurdle-turned-support of $8,200 five days later, before rallying above $10,000.
While the ongoing correction may be extended, the crucial support at $9,075 will likely hold, as the longer duration charts are reporting strong bullish conditions.
Weekly chart

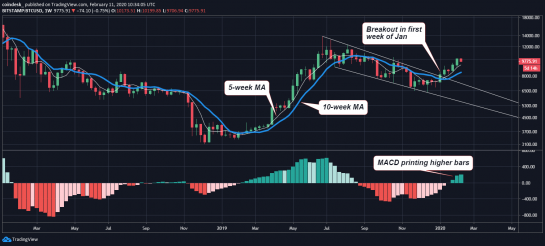
Bitcoin has risen strongly over the last few weeks, having witnessed a falling channel breakout in early January.
The MACD histogram is printing higher consecutive bars above the zero line, a sign of the strengthening of bullish momentum. The 5- and 10-day averages are also trending north in favor of the bulls.
Overall, the weekly chart is aligned in favor of a rally to the October high of $10,350.
Disclosure: The author holds no cryptocurrency at the time of writing
Disclosure Read More
The leader in blockchain news, CoinDesk is a media outlet that strives for the highest journalistic standards and abides by a strict set of editorial policies. CoinDesk is an independent operating subsidiary of Digital Currency Group, which invests in cryptocurrencies and blockchain startups.


