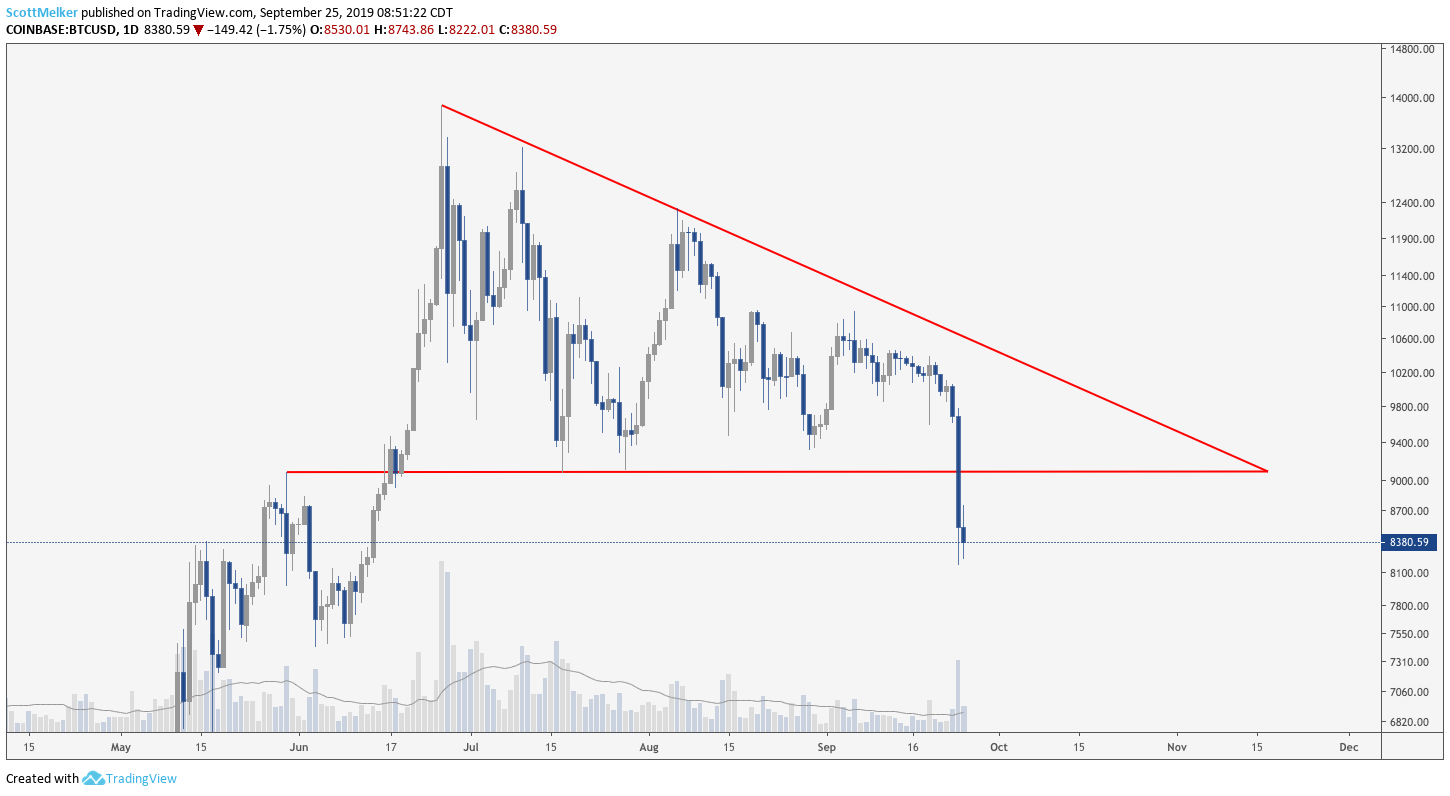
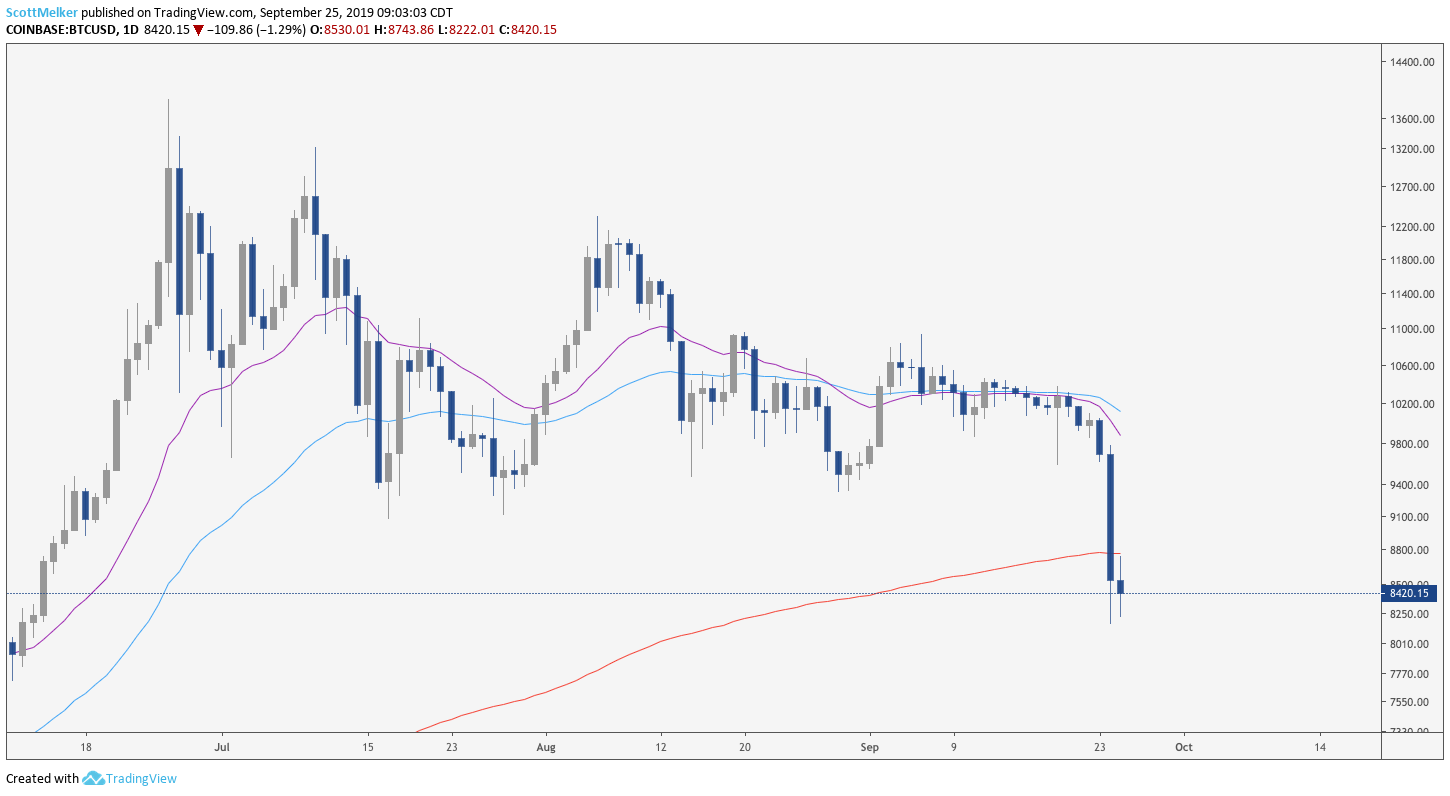
Bitcoin price made a strong downside move yesterday, dropping nearly 16% from the daily open at $9,691 to a new local low at $8,164. In doing so, price broke strong support at $9,090 and exited the range that it has been trading in since June. Bitcoin’s price action remains bearish below this range.
BTC/USD Daily Chart. Source: TradingView
Keep an eye on the patterns
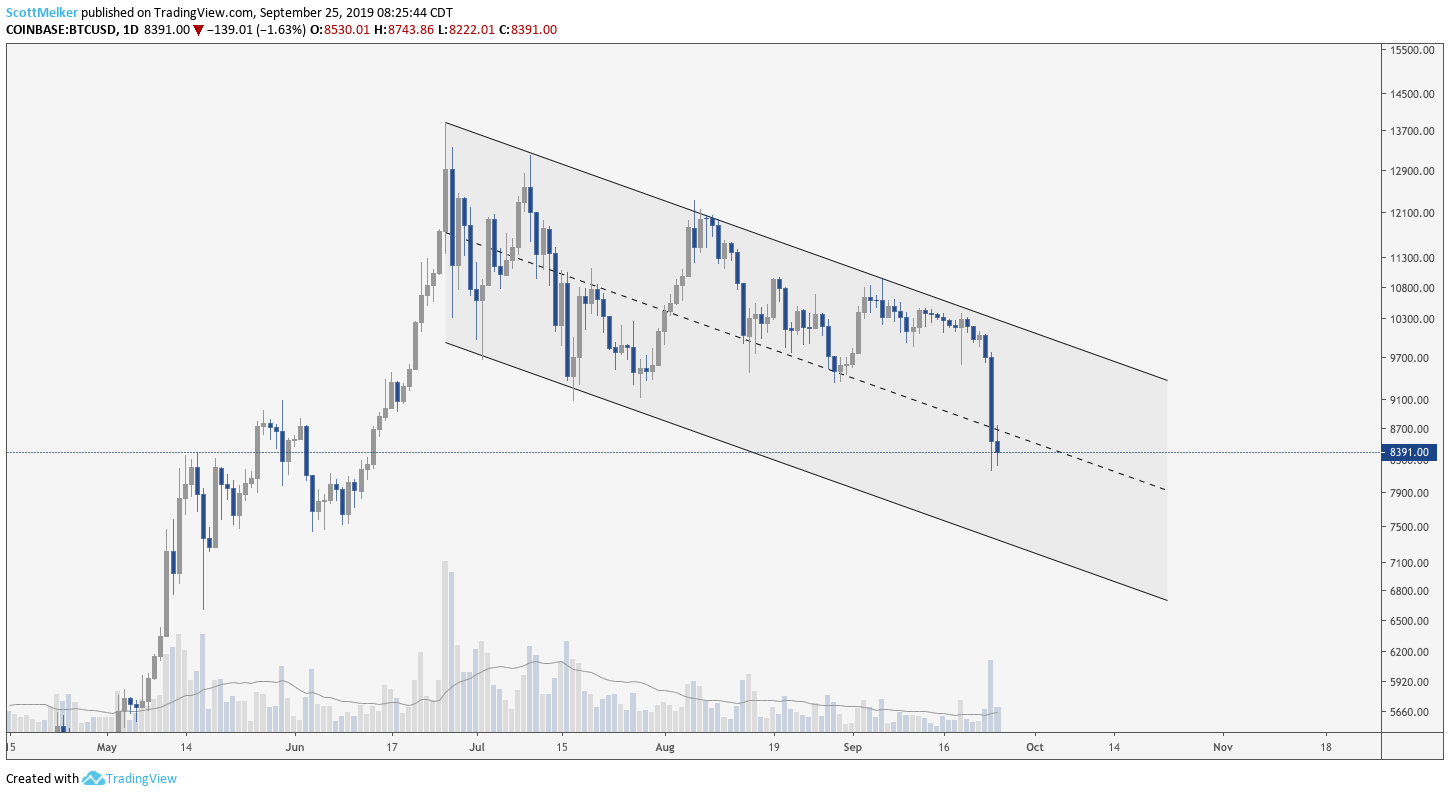
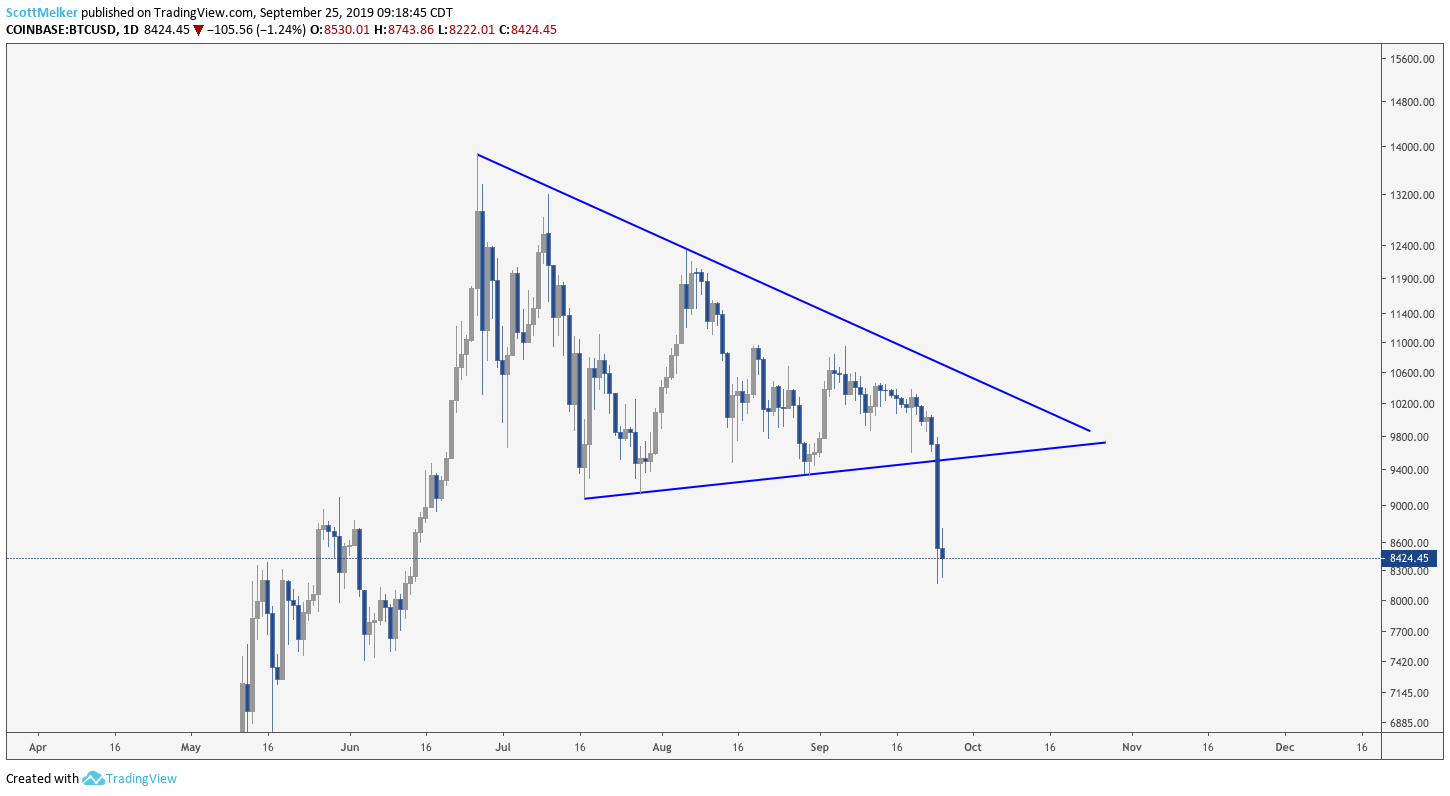
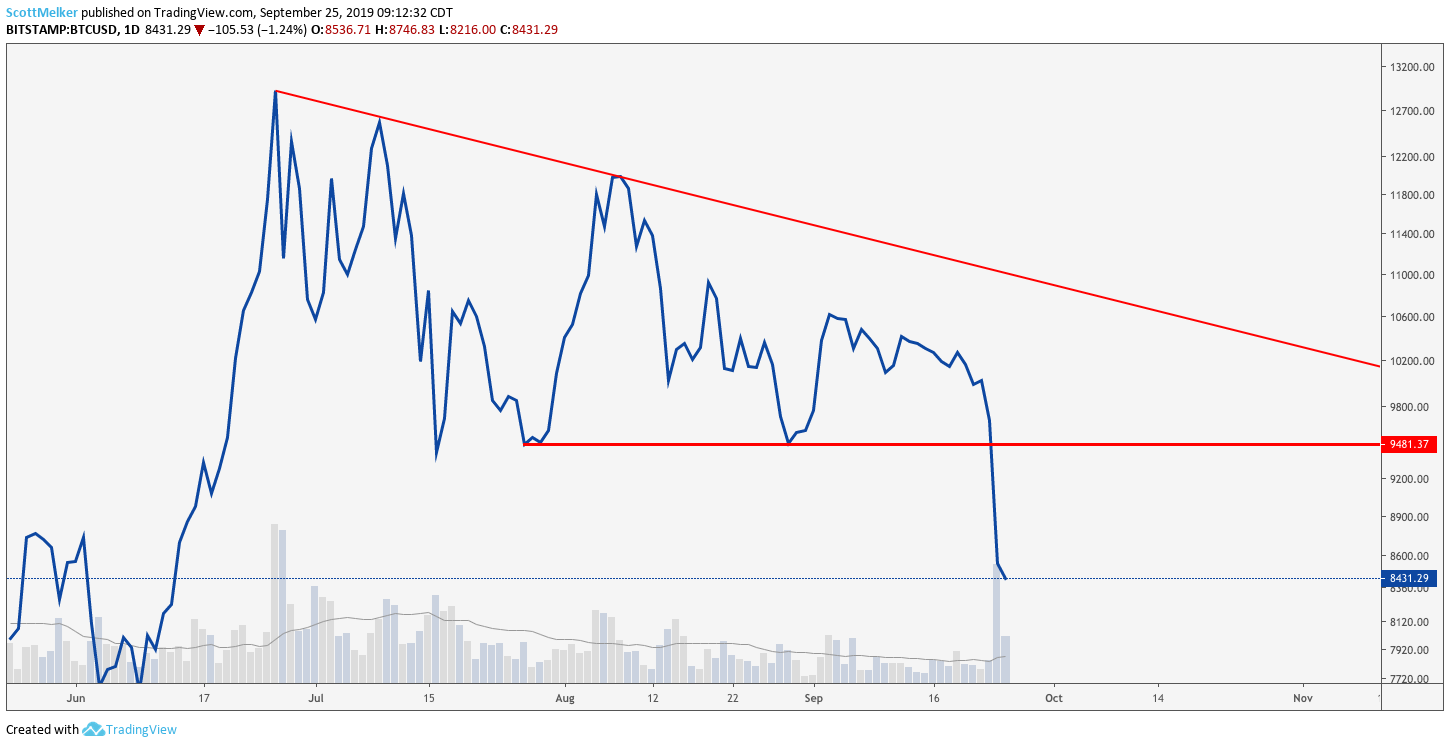
There were three patterns widely identified by traders on the Bitcoin chart — the descending triangle, descending channel and bull pennant. Bitcoin bears pointed to the “descending triangle” on the chart for the reason behind the drop. This pattern was technically unconfirmed on candle charts.
BTC/USD Daily Chart. Source: TradingView
However, the line chart, which only accounts for candle closes, showed a confirmed descending triangle (2 opposing touches up and down) with a much higher horizontal base than was being drawn on candle charts — $9,481 rather than $9,090. Savvy traders were able to catch the break down $300 ahead of most by utilizing the line chart.
Bitcoin bulls viewed this corrective move as a return to the EQ (dashed center line) of the descending channel that confirmed weeks ago on the chart. Price remained above this center line for over a month. Bulls will want to see this area recaptured to indicate likely price appreciation.
BTC/USD Daily Chart. Source: TradingView
Traders that viewed BTC price action as a pennant or triangle were proven wrong, as price made a strong move below support.
BTC/USD Daily Chart. Source: TradingView
Fibonacci levels provided insight
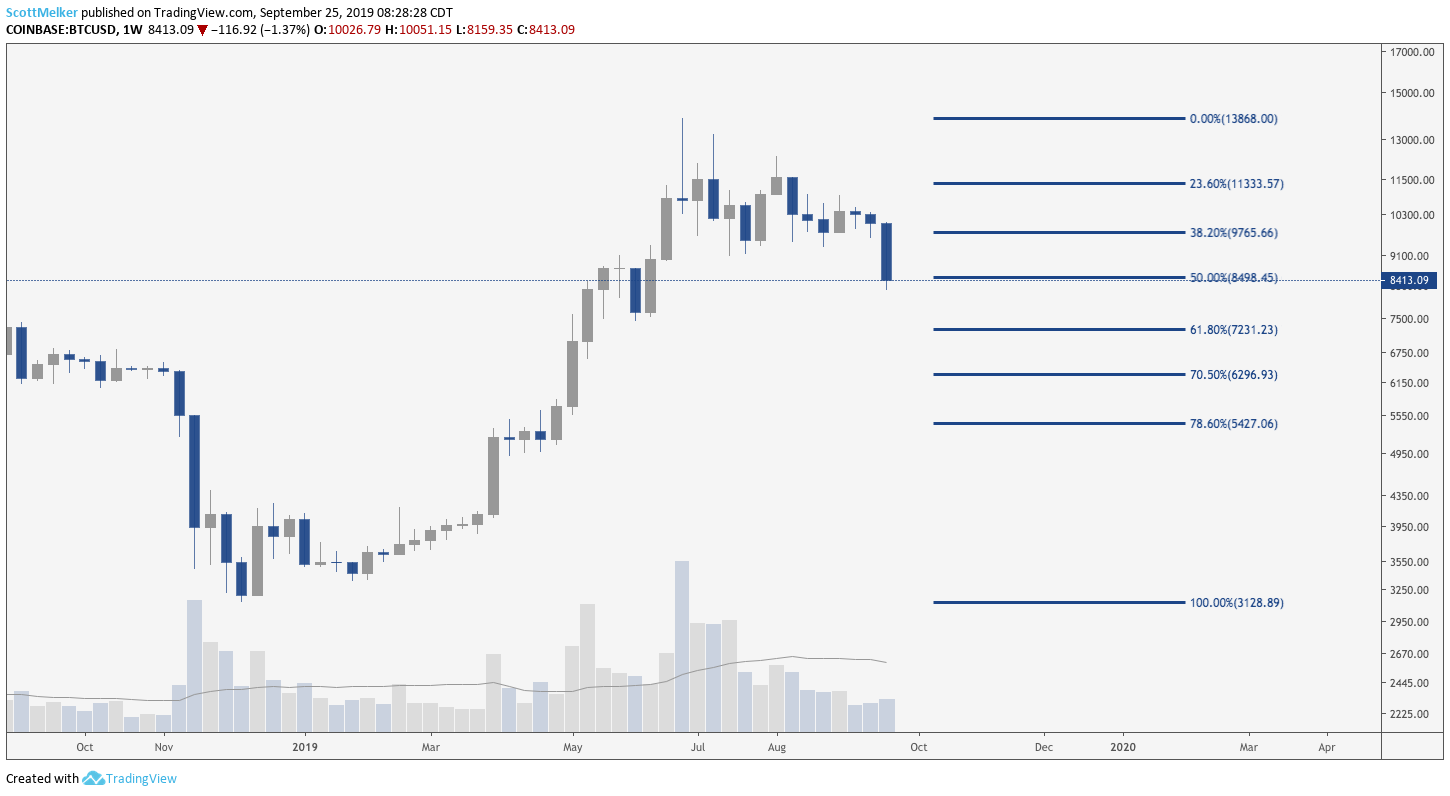
Bitcoin price entered a parabolic uptrend from the bottom at $3,128.89 to the local top at $13,868, where the digital asset then commenced a corrective move. Currently, Bitcoin price is hovering around the 50% retracement — not technically a Fibonacci level, but an area that legacy traders have watched for decades and frequently refer to as the “Dow level.”
Bitcoin price consolidated at both the 23.6% and 38.2% Fib retracement levels before moving into a larger correction. The price remains more “corrective” than “bearish” on longer multiple time frames, as a 50% move is expected in a strong bull market.
In fact, the “golden pocket” retrace would be closer to the $7,200 level, and would still be considered bullish.
Institutional traders view the Optimal Trade Entry (OTE) as a 70.5% retracement, which would be $6,296. The macro landscape remains bullish, and within the realm of a “healthy correction.”
BTC/USD Weekly Chart. Source: TradingView
Are we overdue for an oversold bounce on the Relative Strength Index?
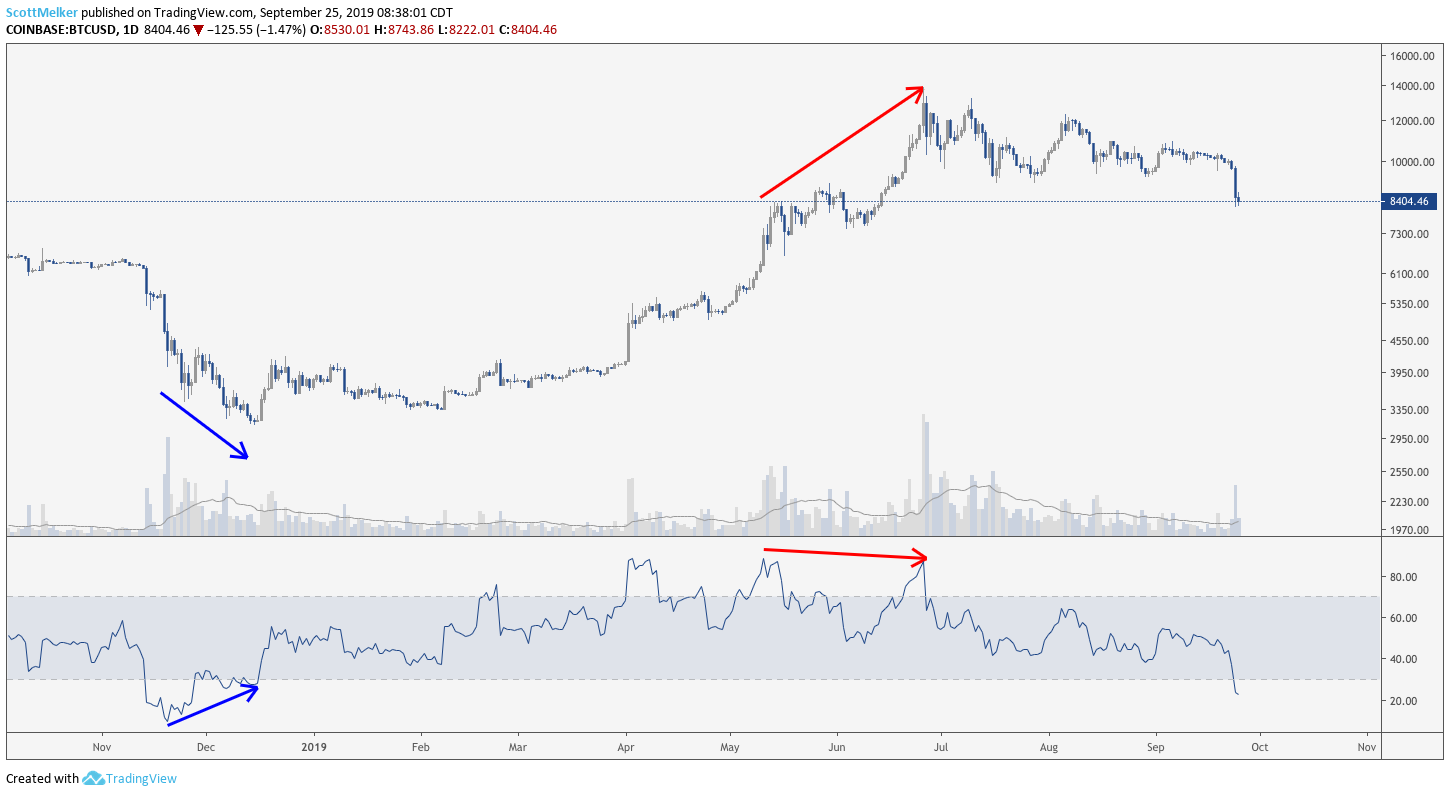
The daily Relative Strength Index (RSI) is currently sitting at 23, strongly oversold and the lowest that it has been in 2019. For comparison, at the $3,128 low, the RSI was roughly 27.
It dropped to 10, weeks before the eventual low in price and levels this low suggests the likelihood of a bounce in Bitcoin price, at least for temporary relief.
Lower time frames are even further oversold, with the popular 4 hour RSI hitting an astounding low of 10.5 RSI. Traders who heavily utilize RSI expect that the oscillator will move from overbought to oversold and vice versa on every time frame.
Traders should note that the RSI was dramatically overbought at the June high, with a bearish divergence on RSI. Therefore, the expectation was to see Bitcoin price continue down to coincide with the oversold RSI, which has now occurred.
Divergence traders will look for an eventual bullish divergence in oversold territory to signal the likely bottom, as it did at the $3,128 low. This would require price making a lower low in a few days, with RSI continuing to push up, making a higher low.
BTC/USD Daily Chart. Source: TradingView
The weekly RSI also crossed below 50, a strong bearish signal. That said, there are still 4 days remaining until the weekly close, so this remains unconfirmed for now.
The TD Sequential says buy the dip
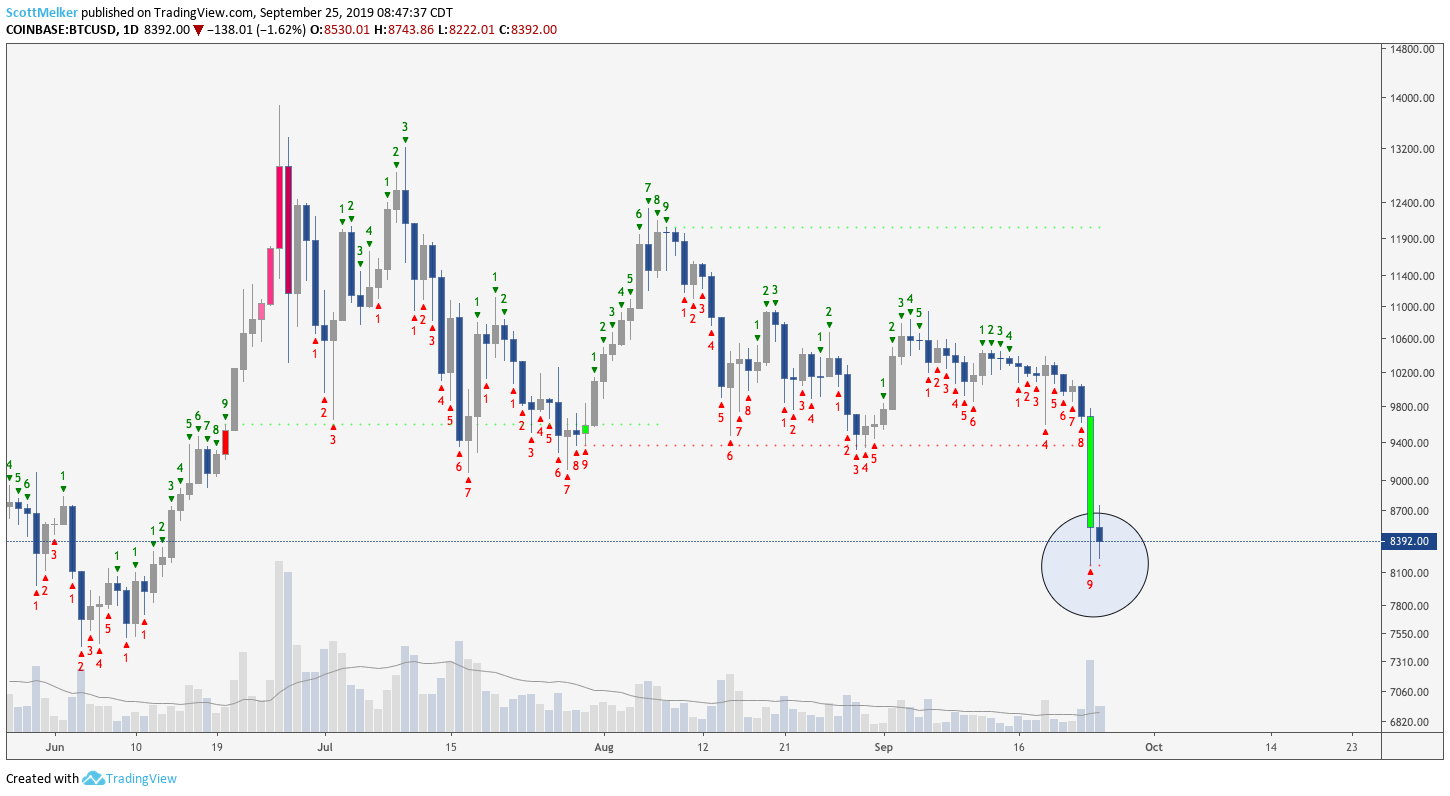
The popular TD Sequential indicator is flashing a strong buy signal on the daily chart, although those who use this tool understand that price can often continue down to 13 candles before reversing (if it does).
BTC/USD Daily Chart. Source: TradingView
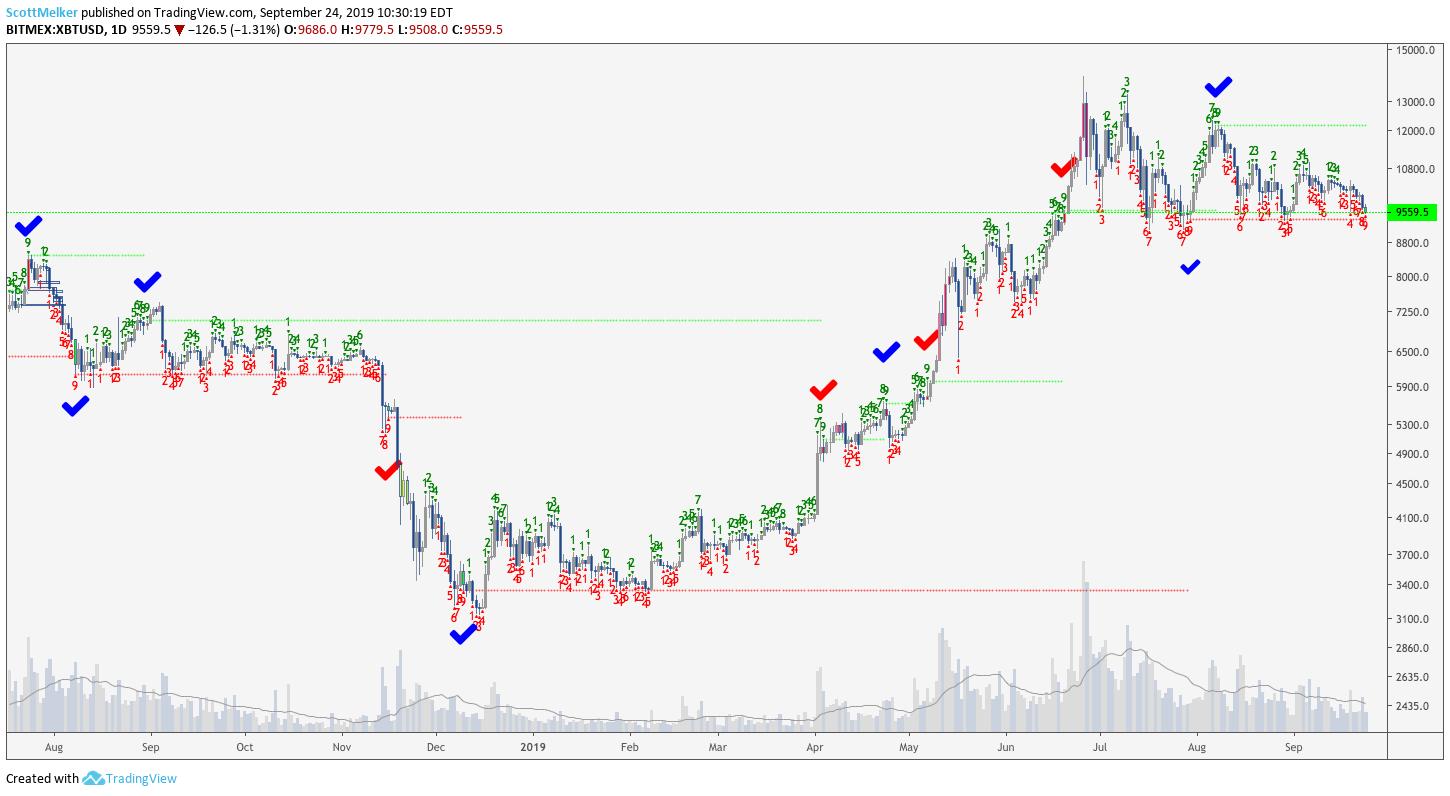
Below is more than a year’s worth of TD Sequential 9s on the daily chart. Blue checks indicate those that played out correctly. Red checks indicate a failure.
Note that the results have been a mixed bag on sell signals, with 4 blue checks and 3 red. This indicator has been far more reliable on the buy side, with 3 blue and only 1 red — in November 2018.
BTC/USD Daily Chart. Source: TradingView
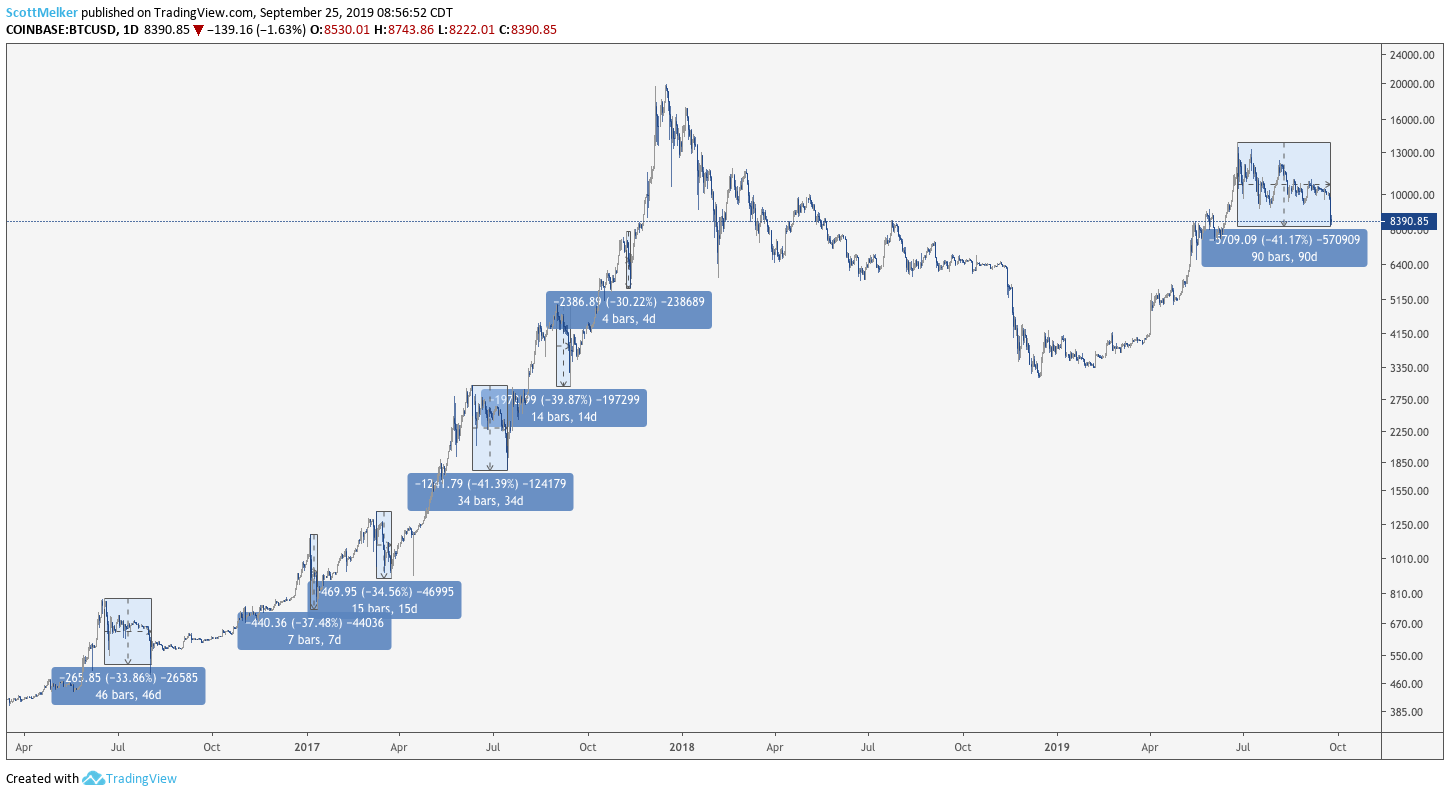
40% drops are the norm in a Bitcoin bull market
Bitcoin bull markets are marked by drops of roughly 40% and the current drop from the 2019 high is 41.17% and at the top of the anticipated range. This process has taken longer than previous corrections in a bull market.
BTC/USD Daily Chart. Source: TradingView
Exponential Moving Averages
The daily chart shows a bearish bias amongst the key Exponential Moving Averages (EMA) (21 in purple, 50 in blue, 200 in red).
BTC/USD Daily Chart. Source: TradingView
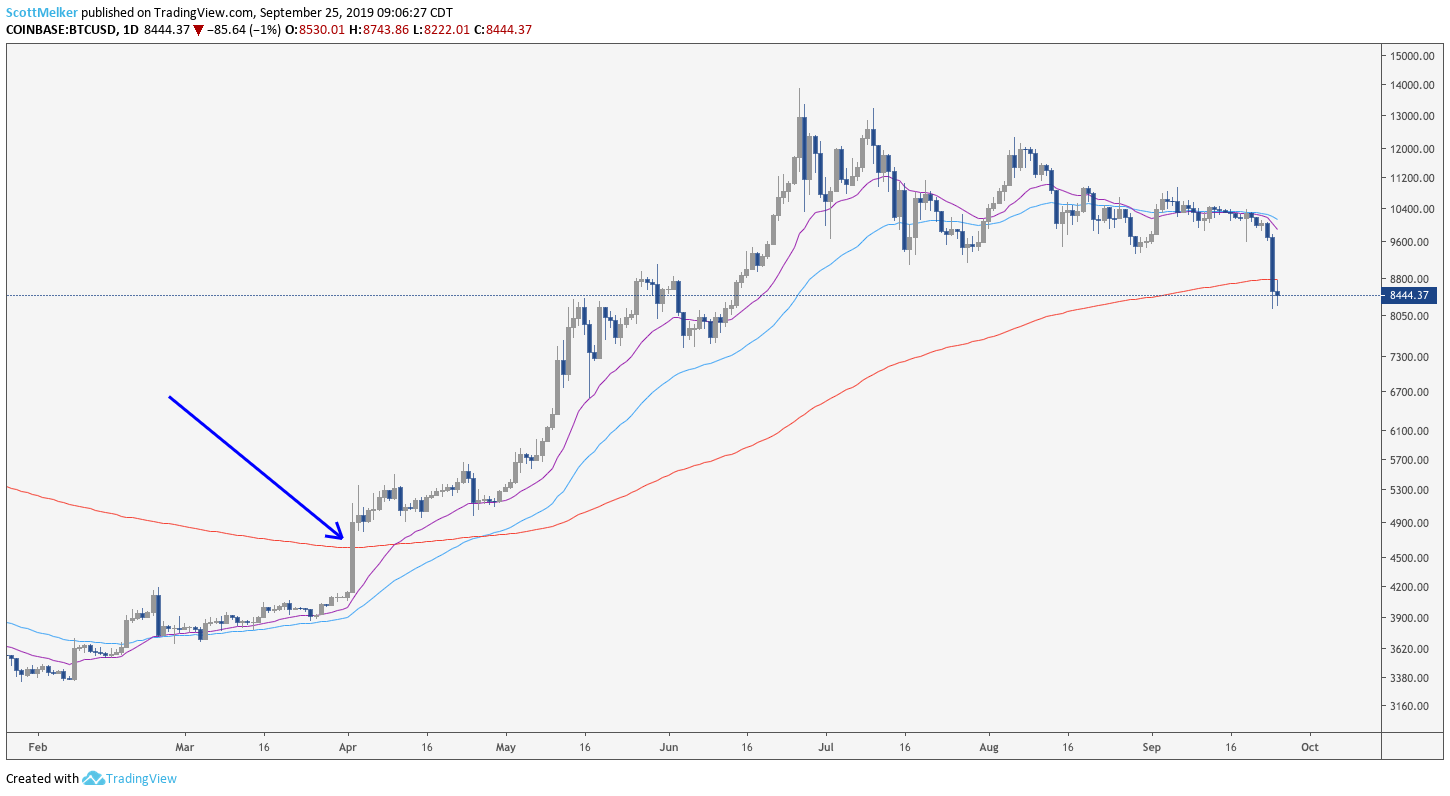
Most importantly, Bitcoin price broke below the 200 EMA for the first time since the massive bullish candle that started at $4,200 and signaled the end of the bear market (the first higher high in price since the all-time high).
The 200-EMA was sitting at roughly $4,600 at that time (blue arrow). Any price action below this line remains bearish.
BTC/USD Daily Chart. Source: TradingView
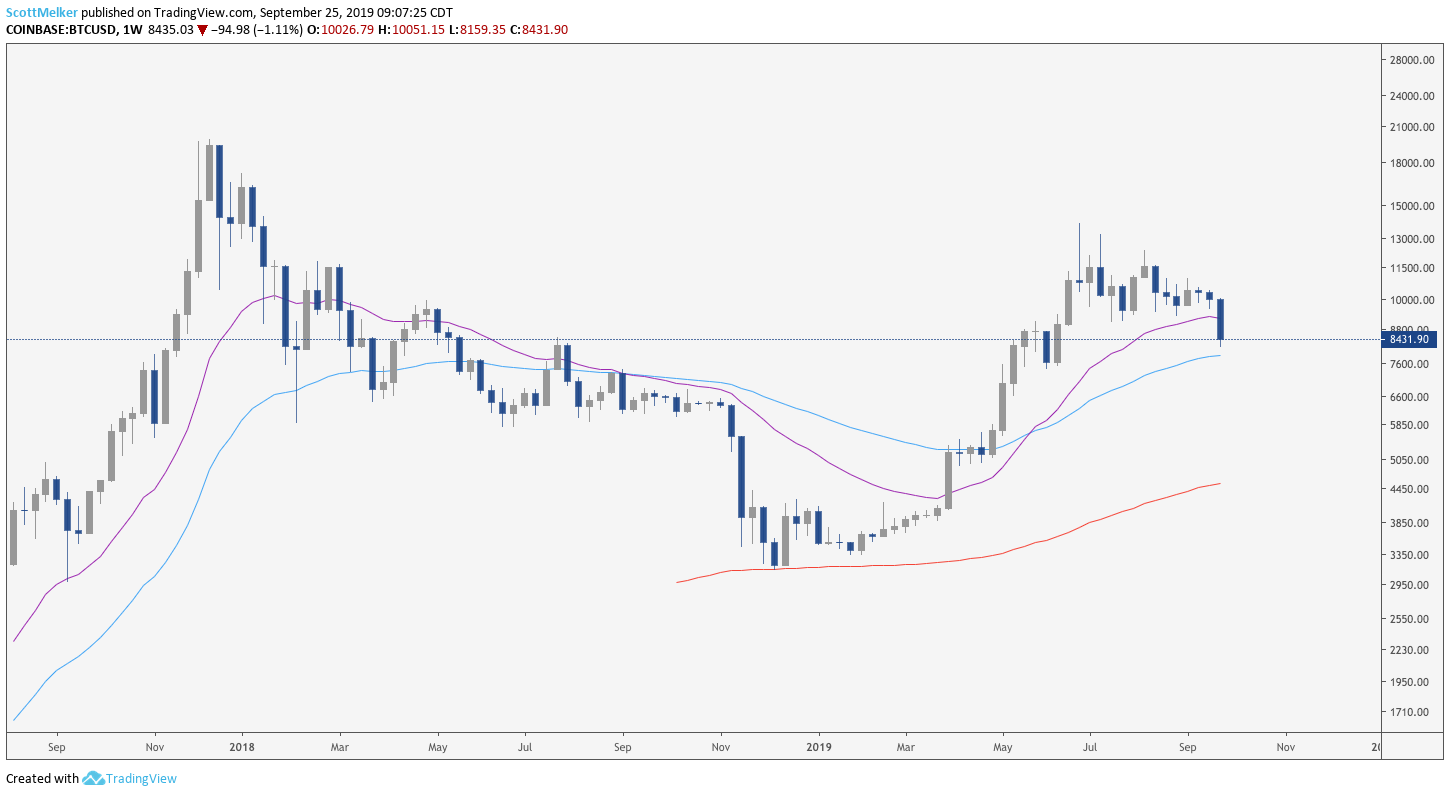
The weekly EMAs show that Bitcoin price has broken below the 21 for the first time since April, which was at roughly $5,300. Currently, Bitcoin is above the 50 EMA and many traders point to it as a likely place for the corrective action to end.
The 50-EMA currently sits near $7,800 and is rising. A touch of the 20-EMA signaled the dead bottom of the last bear market, and currently sits at roughly $4,550. Strongly bearish traders view this as a likely place for the bottom of this corrective move.
BTC/USD Daily Chart. Source: TradingView
Mind the gap!
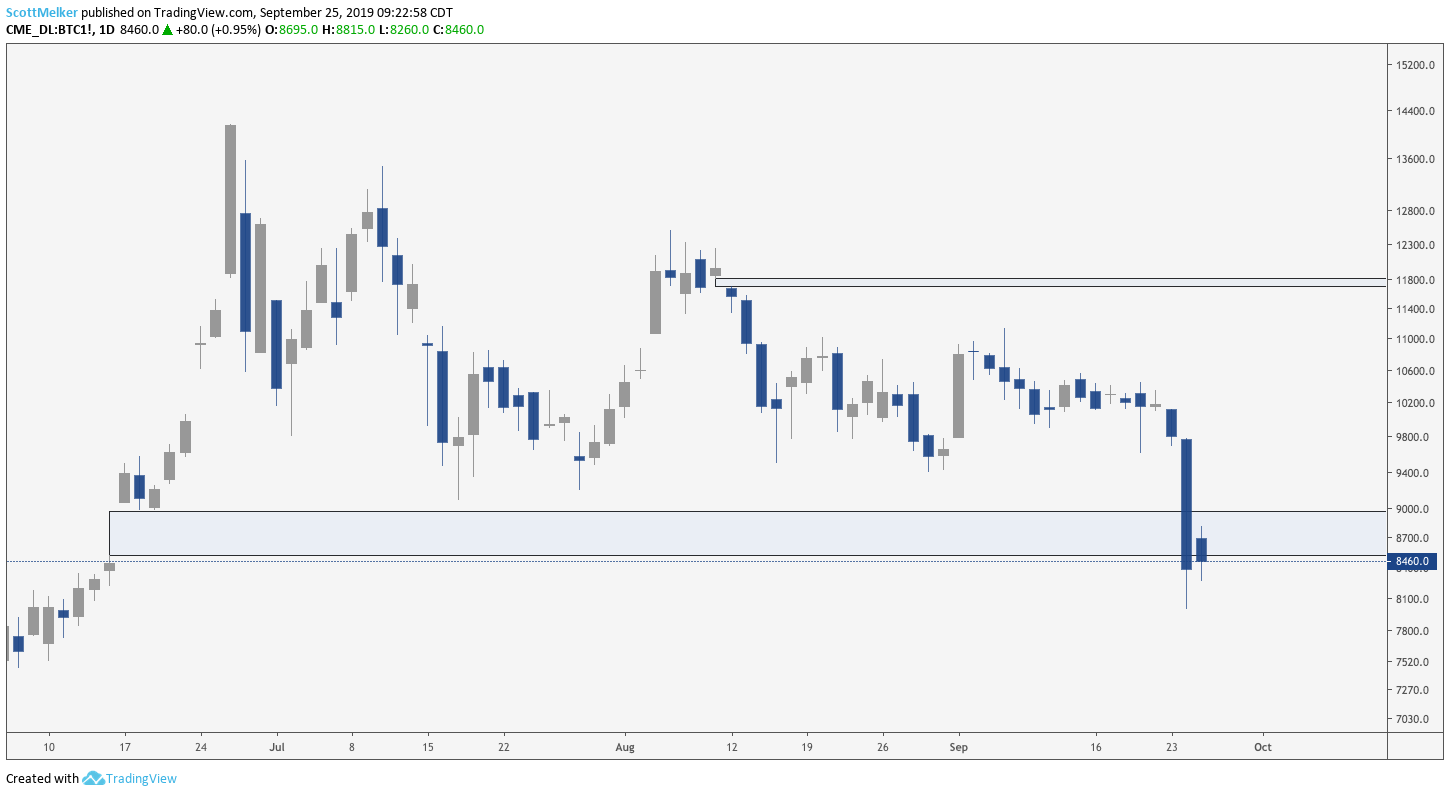
Nature abhors a vacuum and for crypto this is the CME gap.
Traders have been watching the massive gap on the CME futures chart since it was formed in June, asserting that gaps must be filled. While this is not always the case, a strong argument was made for price returning to this area.
Yesterday’s candle definitively filled the CME gap, closing below the bottom. Interestingly, there is also a gap well above the current price, at roughly $11,700. Those who were sure that the lower gap required filling should be eyeing that upper area for an eventual move.
BTC/USD Daily Chart. Source: TradingView
Where to from here?
Yesterday’s price movement, while significant, should not have caught traders off guard. The larger picture shows consistent price action with previous corrections.
Further price depreciation will have traders looking to EMAs, Fib levels and key supports for a bottom, as well as eventual potential bullish divergence with RSI on the daily chart.
Bears will look for continued price movement down, or previous supports remaining as resistance.
The views and opinions expressed here are solely those of the author (@scottmelker) and do not necessarily reflect the views of Cointelegraph. Every investment and trading move involves risk. You should conduct your own research when making a decision.


