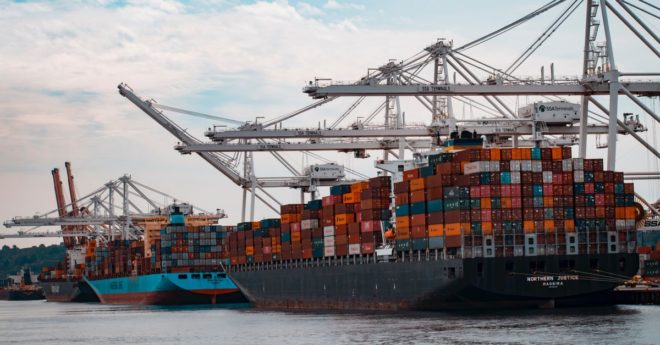
The following chart doesn’t answer who is correct. But it does put some illustration onto the supply chain problem. This is the deep sea freight cost component within the Bureau of Labor Statistics’ producer price index for the past two years, drawn from the Federal Reserve Bank of St. Louis’s FRED database.
Related posts
-
Bitcoin Supply Reaches 19.8 Million Mark, Nearing Maximum Limit
Data reveals that Bitcoin’s total circulating supply has surpassed the 19.8 million mark, a notable milestone... -
Stablecoin Frenzy: USDE Nears $6B as USD0 Rockets Past $1B in Market Supply
Over the past month, the stablecoin market has swelled... -
Bitcoin Will Test ATH Once It Breaks This Strong Supply Zone – Details
Este artículo también está disponible en español. Bitcoin is currently trading at $97,600, following a sharp...