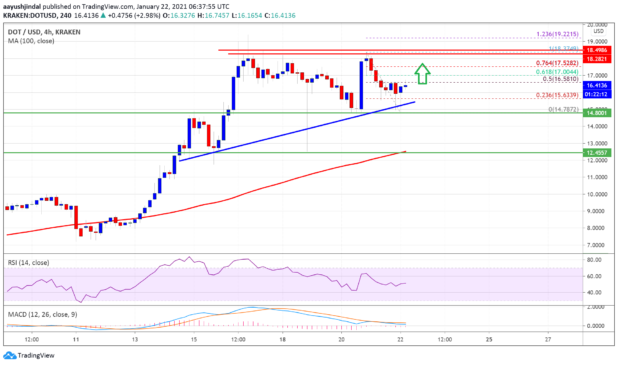
Polkadot’s DOT surged towards $18.50 before correcting lower against the US Dollar. It is holding gains above $15.00 despite a crash in bitcoin and Ethereum.
- DOT rallied above $12.00 and $15.00 before it faced sellers near $18.50 against the US dollar.
- The price is trading nicely above the $15.00 support and he 100 simple moving average (4-hours).
- There is a key bullish trend line forming with support near $15.50 on the 4-hours chart of the DOT/USD pair (data source from Kraken).
- The pair remains in a positive zone and it is likely to continue higher towards $18.50 and $20.00.
Polkadot’s DOT Stable Above $15
After a close above the $12.00 level, DOT started a fresh rally above the $15.00 resistance level. There was a strong bullish momentum above $15.00 and the price even climbed above $18.00.
However, the bulls failed to test the $20.00 level. The recent high was formed near $18.37 and the price recently corrected lower. There was a break below the $16.50 support level, but the bulls were active near the $15.00 and $14.80 support levels (a multi-touch zone).
A low is formed near $14.78 and the price is currently rising. It broke the $16.00 level and tested the 50% Fib retracement level of the downward move from the $18.37 swing high to $14.78 low.
Source: DOTUSD on TradingView.com
There is also a key bullish trend line forming with support near $15.50 on the 4-hours chart of the DOT/USD pair. The price is clearly trading nicely above the $15.00 support and he 100 simple moving average (4-hours). On the upside, a break above the $16.60 level could spark a fresh increase.
The next key resistance could be near $17.50 or the 76.4% Fib retracement level of the downward move from the $18.37 swing high to $14.78 low. Any more gains may possibly call for a break above $18.50.
Fresh Dip?
If DOT price fails to continue higher above $16.50 and $17.00, there could be a fresh decline. The first key support is near the $15.50 level and the trend line.
A successful break below the trend line support could put the $15.00 support at a risk. Any more losses may possibly call for a drop towards the $14.00 level.
Technical Indicators
4-Hours MACD – The MACD for DOT/USD is gaining momentum in the bullish zone.
4-Hours RSI (Relative Strength Index) – The RSI for DOT/USD is still above the 50 level.
Major Support Levels – $15.50, $15.00 and $14.80.
Major Resistance Levels – $16.50, $17.20 and $18.50.


