Market capitalization and ‘flippenings’ happen to be important reflections of value for many crypto pundits and investors.
Anyone who’s been in the game since 2017 will recall the heated discussions revolving around the Ether (ETH) to Bitcoin (BTC) flippening and the same commotion was caused by Bitcoin Cash (BCH) and EOS flipping top blockchains as they moved into the top-5.
Now traders’ attention has shifted to Polkadot (DOT) as the network is currently ranked top-5 cryptocurrency by market capitalization and it seems that its ascension to the top came out of the blue.
The network aims to be a decentralized web where its users control applications, services, and institutions and contributors to the project include some well-known names like Ethereum co-founder Gavin Wood.
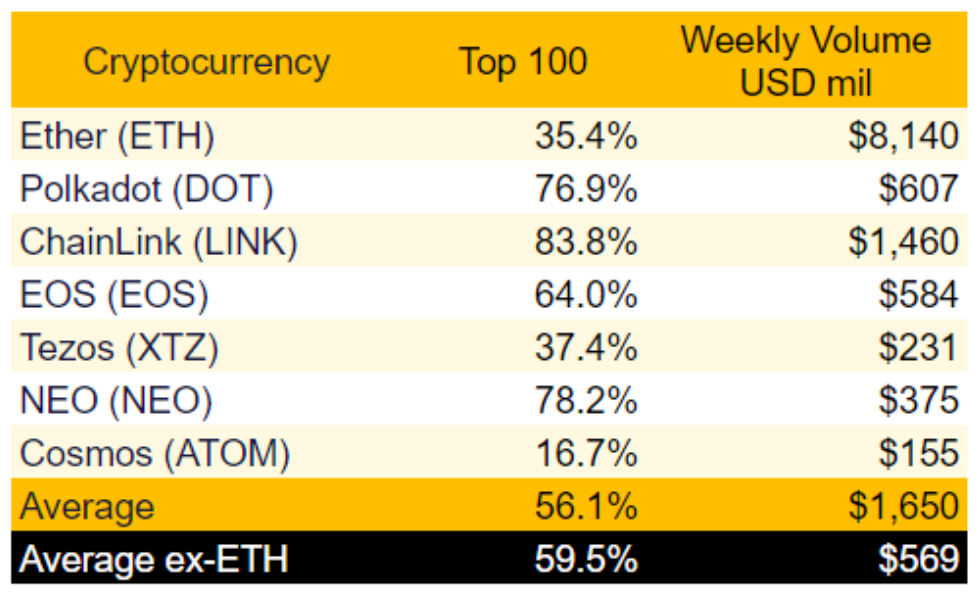
Despite being listed at major exchanges less than 30 days ago, Polkadot token is mind-blowing even to professional traders. Interestingly, its $600 million in weekly transparent volume has matched veterans like Bitcoin Cash and Litecoin (LTC).
Furthermore, DOT’s price action seems to be somehow anticipating Ether’s by 15 minutes to 4 hours.
Weekly transparent volumes. Source: Nomics
Small cap altcoins mimic Ether and Bitcoin price action
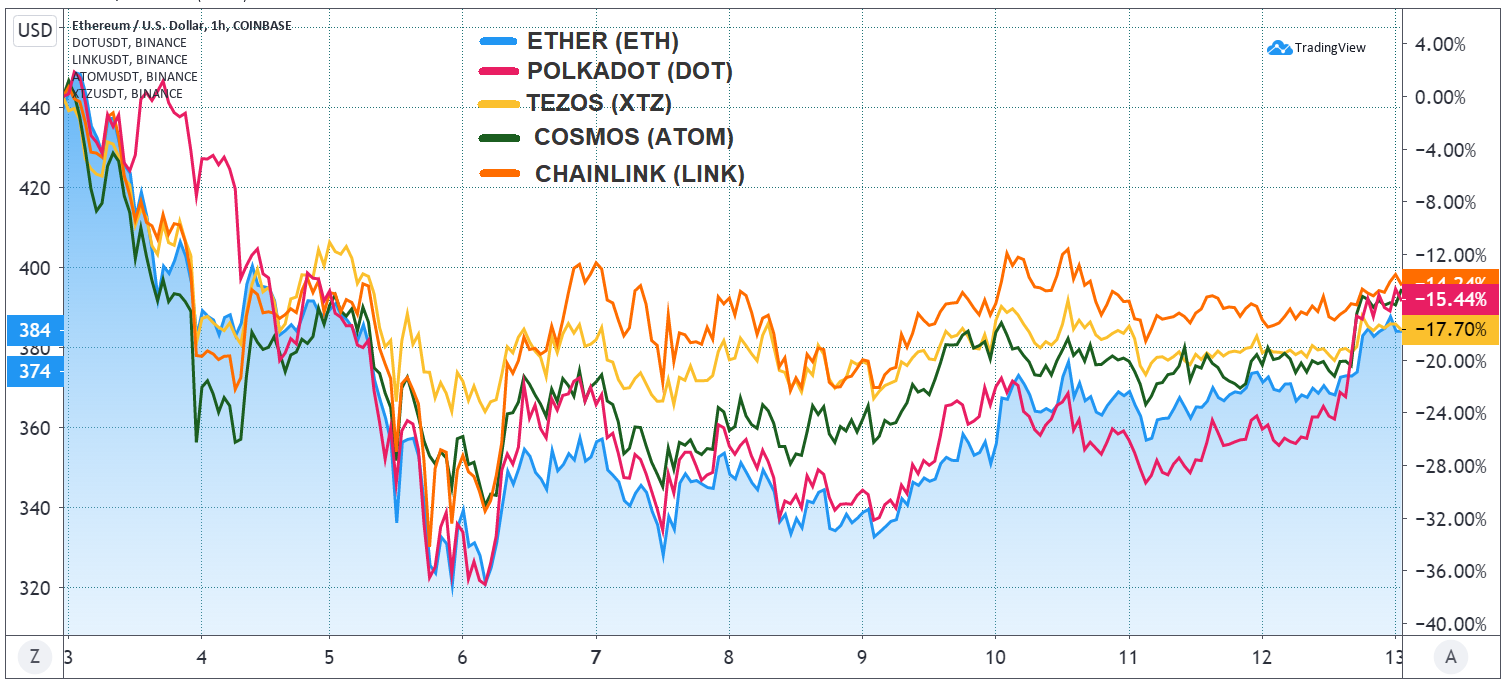
Usually there is a very high intraday performance resemblance between Ether and its indirect competitors that focus on governance, oracles, and interoperability.
Ether, DOT, LINK, ATOM, XTZ, Sept. price action. Source: TradingView
Nevertheless, sometimes one of these altcoins anticipates Ether movements. For DOT, this effect can be partially explained by its lower trading volumes and the fact that 77% of the total supply is concentrated among 100 wallets.
While a single $2 million sell order might impact Tezos’ (XTZ) $230 million weekly transparent liquidity, a $20 million sell order for Ether is a non-event as its market cap hovers around $8 billion.
Source: Etherscan, Polkastats, Eosflare, Tezblock, Tokenview.com, Nomics
It is worth noting that some cryptocurrencies limit the staking or voting amount per address, causing whales to split their holdings and further distorting holders’ rankings. Regardless, DOT’s concentration stands out, as does ChainLink (LINK) and NEO.
Therefore, it is no surprise that any relevant flow on those less distributed names causes more impact. Although decreased volume usually entices more volatility, this is not a reason for any of the cryptocurrencies studied to anticipate Ether’s movements.
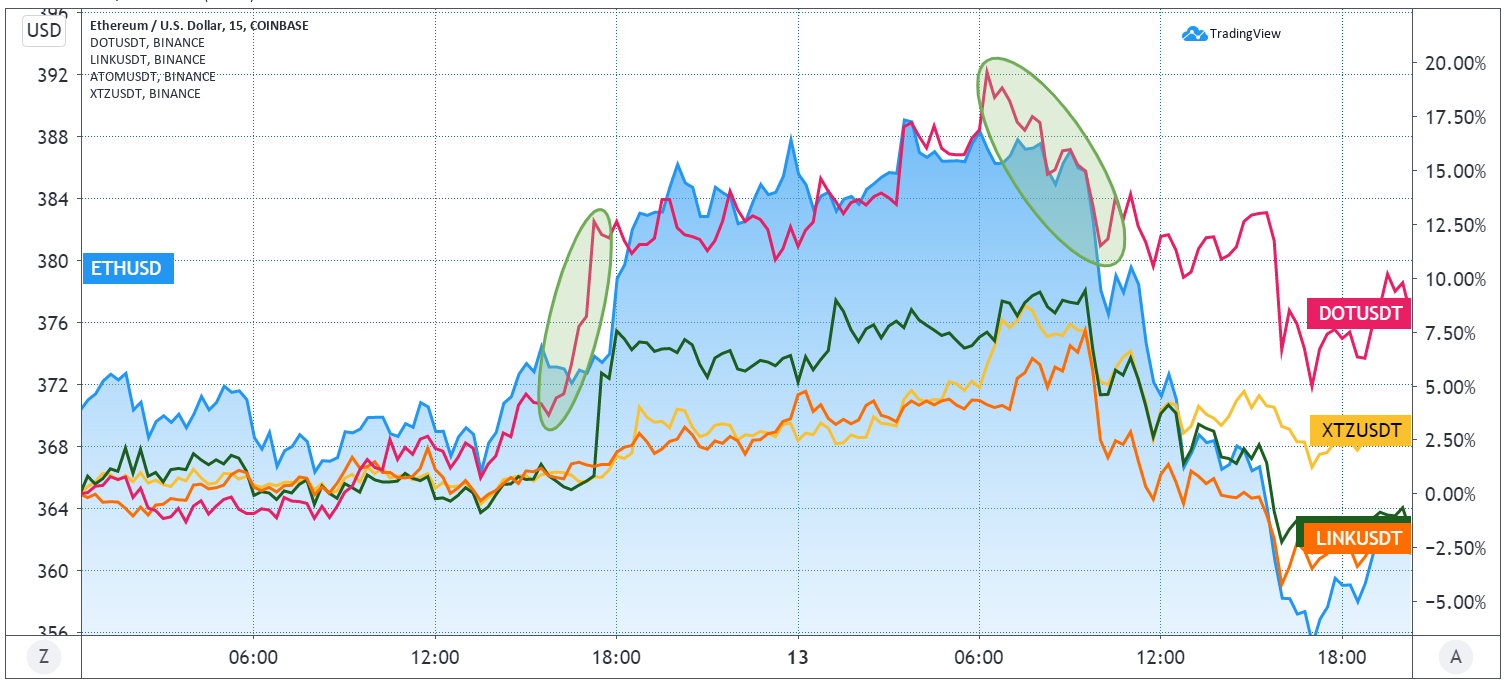
Ether against DOT, LINK, ATOM, XTZ, September 12-13. Source: TradingView
As shown above, DOT was the first to make new highs on Sept. 12. It was also the first one to initiate a downtrend on the subsequent day. Sure enough, this event by itself could have been an exception.
Curiously, this pattern seems to have repeated, although varying from 15 minutes up to four or five hours in advance.
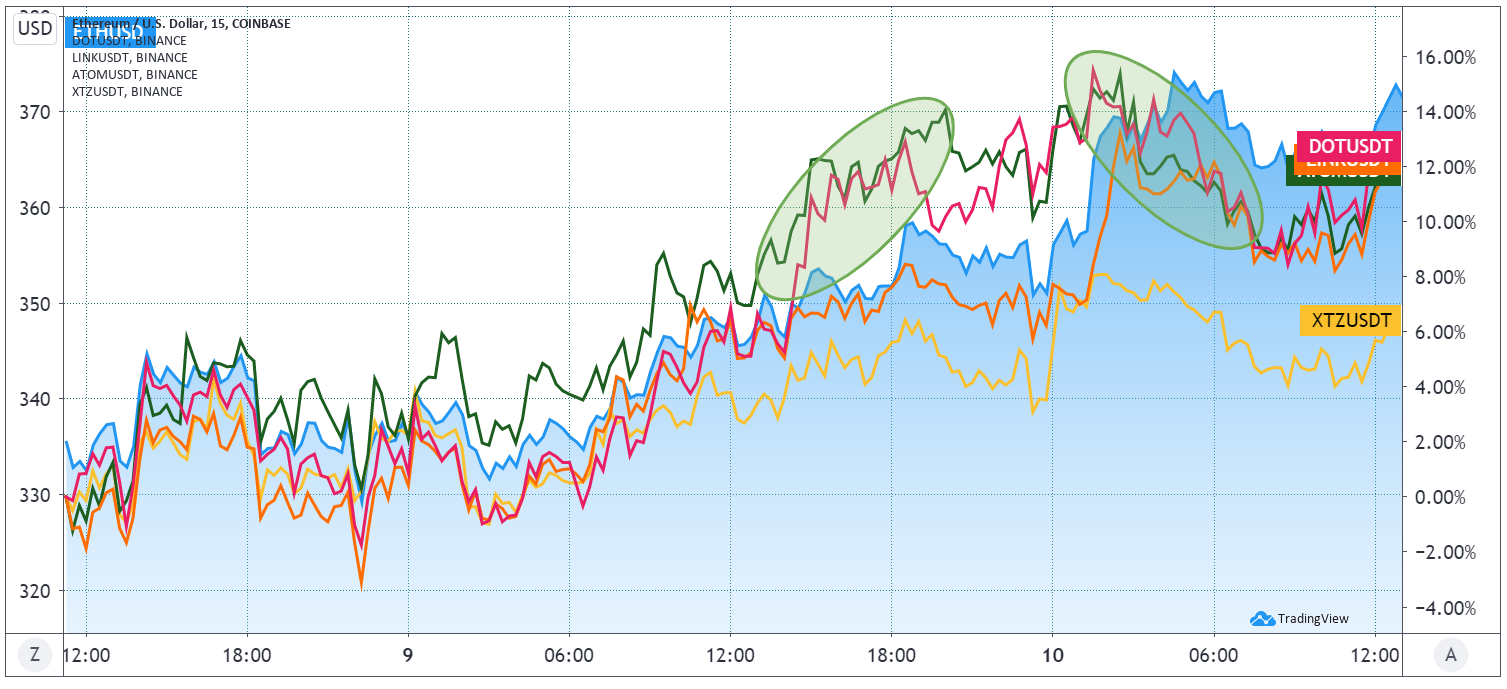
Ether against DOT, LINK, ATOM, XTZ, September 9-10. Source: TradingView
The above chart depicts two different rallies that happened earlier. Both DOT and Cosmos (ATOM) anticipated the Ether rally on Sept. 9 and the subsequent descent on the next day.
Again, numerous factors could be behind those predictive Ether movements on smaller cryptocurrencies, and some will not be replicated, thus creating false alerts.
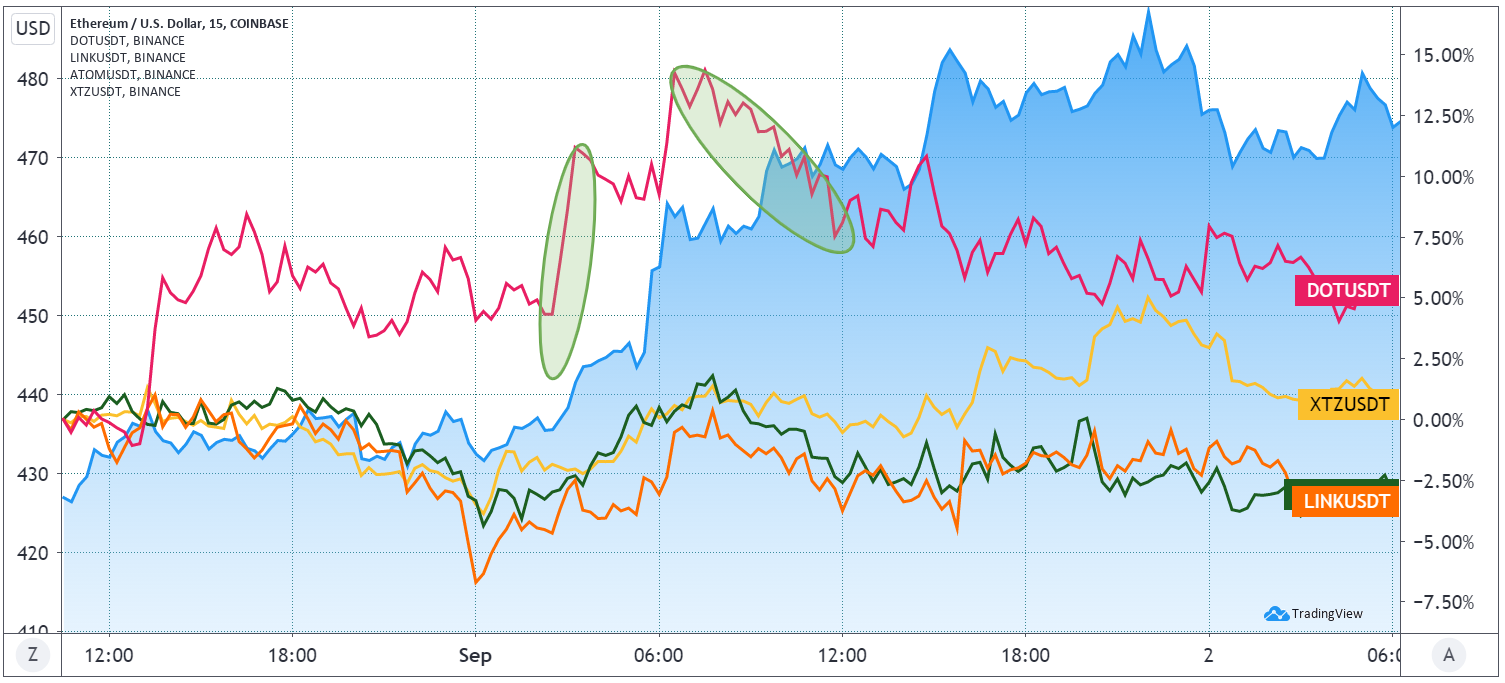
Nevertheless, DOT’s presence on those assertive movements seems unusual over the last two weeks. The following chart is even more telling as the remaining cryptocurrencies remained relatively flat compared to DOT’s impressive moves.
Ether against DOT, LINK, ATOM, XTZ on Sept. 1. Source: TradingView
For starters, both Ether and DOT had been making new local highs in early September. During this time DOT began a strong rally two hours ahead of Ether, and it also initiated its trend reversal earlier than Ether.
Meanwhile, Ether peaked at $490 much later that day. The trend was reversed for both cryptocurrencies on Sept. 2. This strongly contrasts with XTZ, LINK, and ATOM, which either peaked much later or failed to create new highs on Sept. 1.
Is this pure luck or is basket trading behind the pattern?
It’s almost impossible to pinpoint the cause and effect of such short-term trading distortions. Some large investment funds participating in diversified crypto baskets could explain the current unique price action.
Even though their proportional stake in Ether is likely higher, its price impact could be deemed irrelevant considering its liquidity.
Considering DOT’s short trading history on major exchanges, the current trend seems to be an odd coincidence rather than the result of a structured strategy. The same can be said for the many false positives and opposing movements that happened exclusively to DOT that were not replicated by Ether.
Will the Polkadot indicator continue to be useful? Time will tell, but for now, keeping a close eye on it seems to be paying off.
The views and opinions expressed here are solely those of the author and do not necessarily reflect the views of Cointelegraph. Every investment and trading move involves risk. You should conduct your own research when making a decision.


