Bitcoin is struggling to move up. What are the critical levels to watch out for? Let’s analyze the charts.
The views and opinions expressed here are solely those of the author and do not necessarily reflect the views of Cointelegraph. Every investment and trading move involves risk. You should conduct your own research when making a decision.
Market data is provided by the HitBTC exchange.
The rally in cryptocurrencies has largely been led by Bitcoin (BTC). Its dominance has increased from 51.63% at the start of the year to close to 70% in just over seven months. This shows that the crypto recovery has been a Bitcoin story throughout. Therefore, many traders who had held altcoins in their portfolio are not seeing the same kind of returns as those who majorly own Bitcoin.
Former Wall Street trader Max Keiser believes that Bitcoin’s dominance will hit 80% and altcoins will die. However, we believe that the crypto story is unlikely to remain only about Bitcoin. As it is the leader, initially, institutional players will prefer to buy it. However, as the market matures, many projects with strong use cases will make a strong comeback. Though Bitcoin might continue to be the leader, there will be many altcoins that will generate huge returns for investors.
Bitcoin’s hallmark as digital gold has been validated by physical gold in the past three months. The correlation between the two has risen from 0.496 in the past year to 0.837 in the past three months. This shows that Bitcoin is being seen as a safe haven investment and is also being used for hedging purposes.
BTC/USD
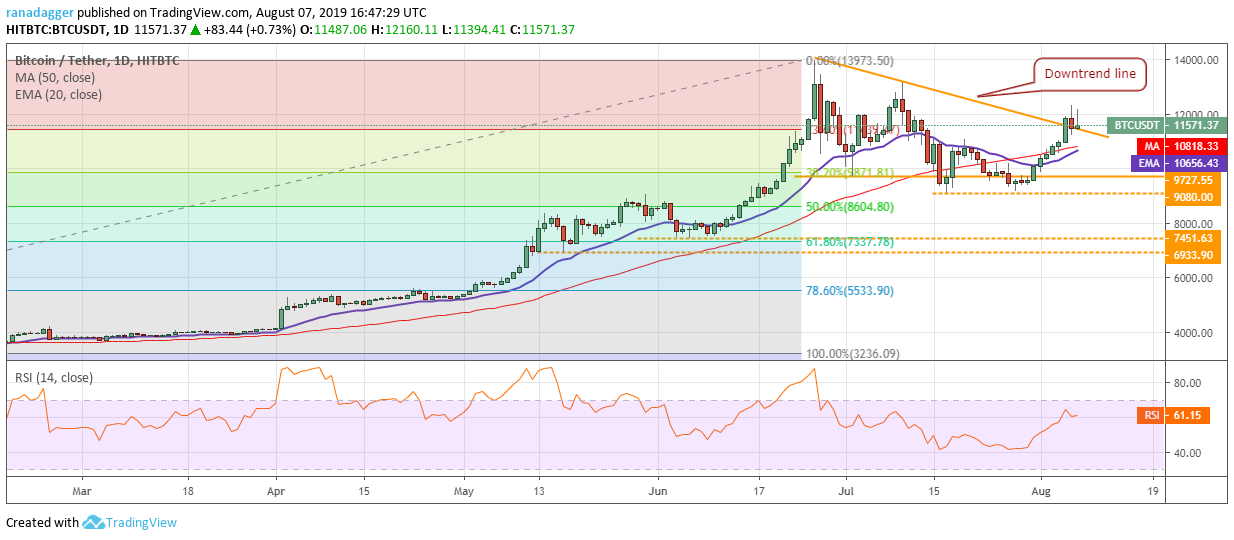
Bitcoin (BTC) rallied above the downtrend line on Aug. 6, but failed to sustain the higher levels. The bears attempted to sink it back below the downtrend line, but bulls held the support. However, the price is again struggling to sustain above $12,000, which shows selling at higher levels.
If the BTC/USD pair breaks below the downtrend line, it will indicate that the breakout on Aug. 5 was a bull trap. A breakdown of both moving averages will further weaken the uptrend. Therefore, traders who had initiated long positions on our recommendation can trail the stop loss to $10,500. Let’s reduce the risk.
Conversely, if the price holds above the downtrend line, it will indicate demand on dips. The moving averages are on the verge of a bullish crossover and the RSI is in the positive zone, which shows that bulls have the upper hand in the short term. The first target on the upside is $13,156.96, above which a retest of the recent highs of $13,973.5 is probable. A breakout of this level is likely to generate FOMO, resulting in a quick surge to $17,208.84.
ETH/USD
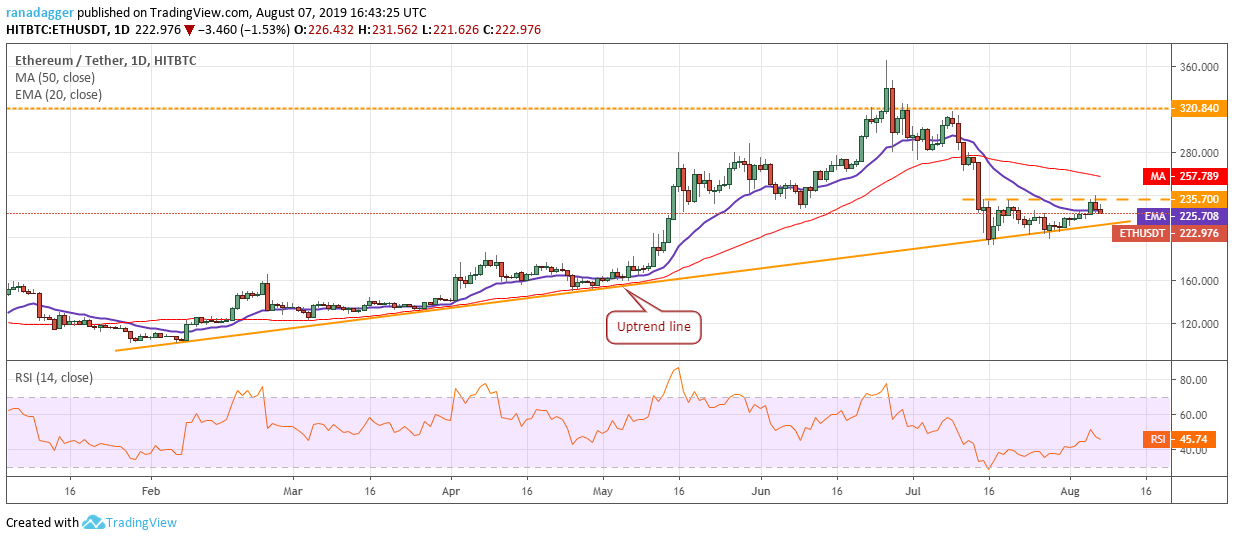
Though Ether (ETH) failed to sustain above $235.70 for the past two days, bulls have managed to keep it above the 20-day EMA, which is a positive sign. As the digital currency is still trading above its uptrend line, we remain bullish on it.
If bulls push the price above $235.70, it is likely to resume its uptrend. The 50-day SMA might offer resistance, but we expect it to be crossed. Therefore, we retain the buy recommendation given in an earlier analysis.
However, if the ETH/USD pair breaks below the 20-day EMA, it will retest the uptrend line. A breakdown of this line will be the first signal that the uptrend is in danger. The pair will start a downtrend on a break below $192.945.
XRP/USD
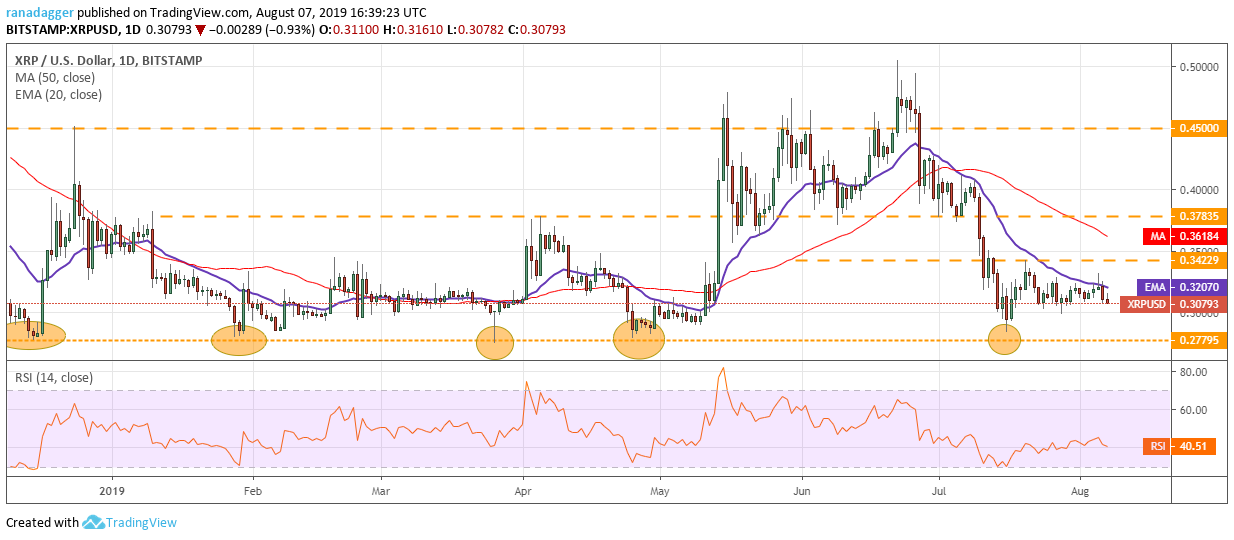
Though XRP rose above the 20-day EMA on Aug. 5, it could not close (UTC time frame) above it. This shows selling at higher levels. The bears will now try to sink the price below the immediate support of $0.30. If that happens, a retest of $0.27795 is probable.
The XRP/USD pair has not broken below $0.27795 since mid-December last year. Hence, we anticipate a strong defence of this level by bulls. On the upside, we expect the pair to show strength if it sustains above $0.34229. Therefore, we retain the buy recommendation given in the previous analysis.
However, if $0.27795 support cracks, the digital currency will start a new downtrend that can extend the fall to $0.19. The downsloping moving averages and RSI in the negative territory show that bears still have the upper hand.
BCH/USD
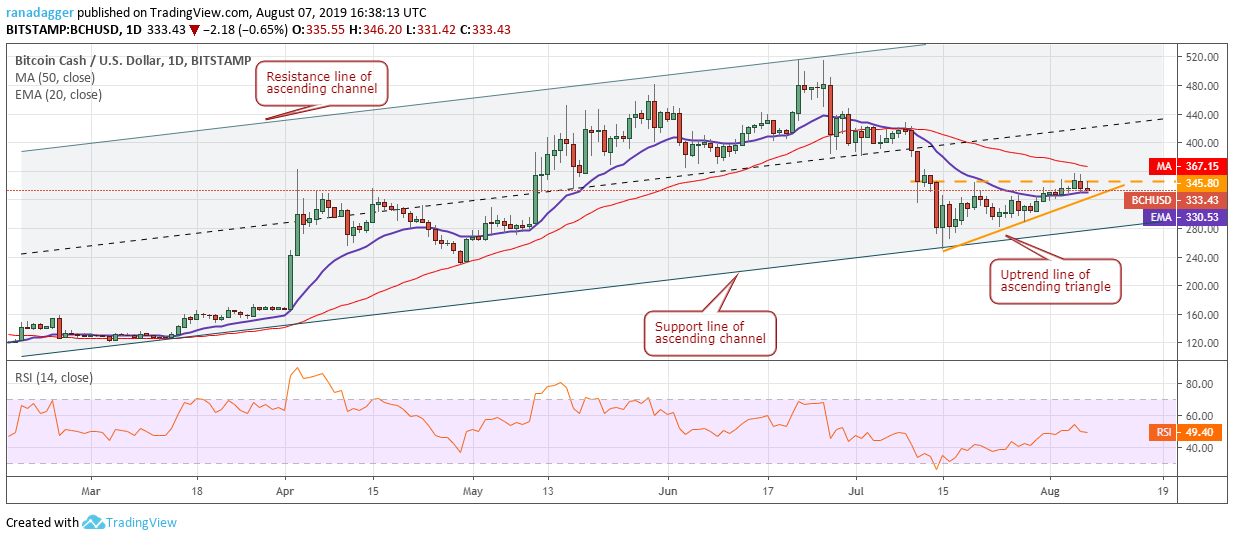
Bitcoin Cash (BCH) triggered our buy level when it closed above $345.80 on Aug. 5. However, it proved to be a fake breakout as the price could not sustain above it and the digital currency quickly dipped back into the triangle on Aug. 6.
Currently, bulls are trying to keep the BCH/USD pair above the 20-day EMA. If successful, we anticipate another attempt to break out of $345.80. The 20-day EMA is flat and the RSI is close to 50, which suggests a balance between buyers and sellers. Traders can trail the stops higher to $300 because if the pair dips below the uptrend line of the ascending triangle, it can decline to the support line of the ascending channel.
LTC/USD
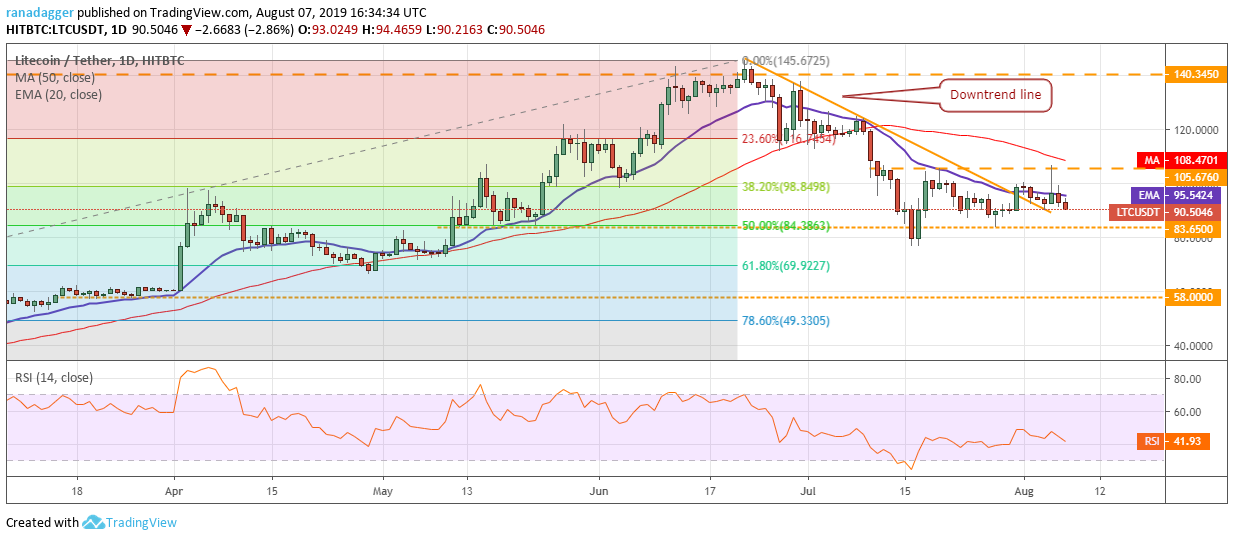
After failing to ascend $105.676 on Aug. 5, Litecoin (LTC) has slipped below the 20-day EMA. This shows selling by traders who had purchased on hopes of a spike following halving. As the digital currency did not close above $105.676, our buy proposed in the previous analysis did not trigger and stands canceled.
The LTC/USD pair can now dip to $83.65, which is likely to act as a strong support. If this level holds, the pair might remain range-bound between $83.65 and $105.676 for a few days. The next up-move or down-move will start on a breakout or breakdown of this range. Until then, we remain neutral on the digital currency.
BNB/USD
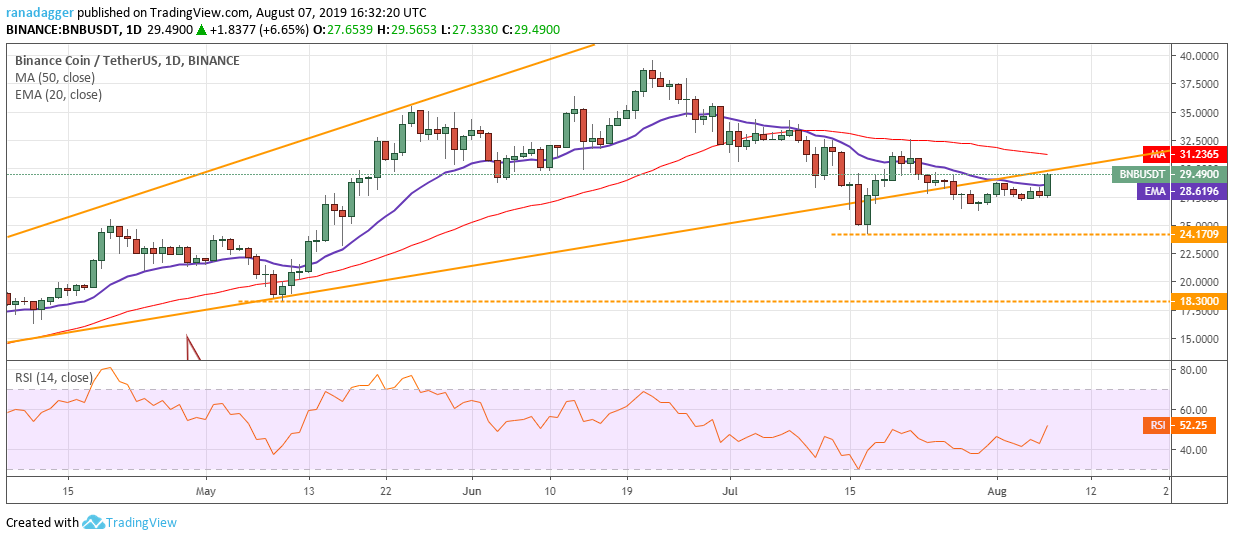
Binance Coin (BNB) has broken above the 20-day EMA and is now attempting to rise above the uptrend line. If successful, it will be a positive sign and will be the first indication that the uptrend has resumed.
The BNB/USD pair might pick up momentum above $32.60. Therefore, traders can buy on a breakout of $32.60 and keep a stop loss of $24. The first target is $39.5941 where we anticipate stiff resistance. Once this level is crossed, the pair is likely to move toward the psychological level of $50.
Contrary to our assumption, if bulls fail to sustain above the uptrend line, the digital currency might enter a consolidation. The flattening moving averages and the RSI close to 50 suggest a balance between bulls and bears. We will turn negative on a breakdown of $24.1709.
EOS/USD
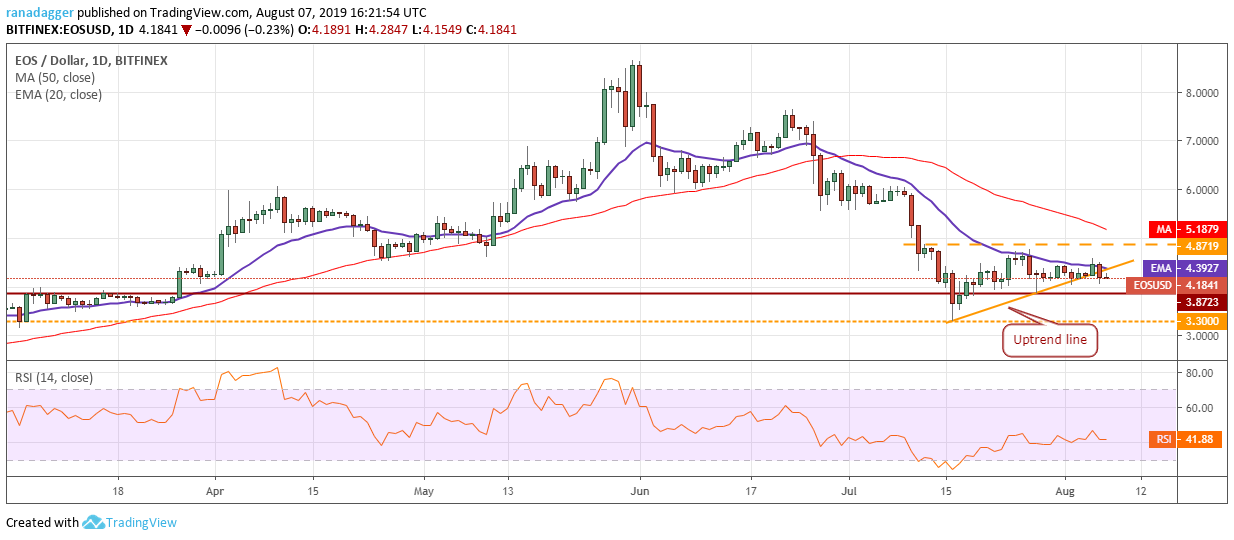
EOS broke below the uptrend line on Aug. 6, which has invalidated the developing ascending triangle pattern. Therefore, we have withdrawn the buy suggested in the previous analysis. We will wait for a new buy setup to form before recommending a trade in it.
If the EOS/USD pair quickly climbs back above the uptrend line, it will be a bullish sign as it will indicate demand at lower levels. Its next target will be a move to $4.8719, above which the pair might pick up momentum.
Conversely, if the price fails to scale above the uptrend line, bears will attempt to sink it below $3.8723. If successful, it can dip to the next support at $3.30.
BSV/USD
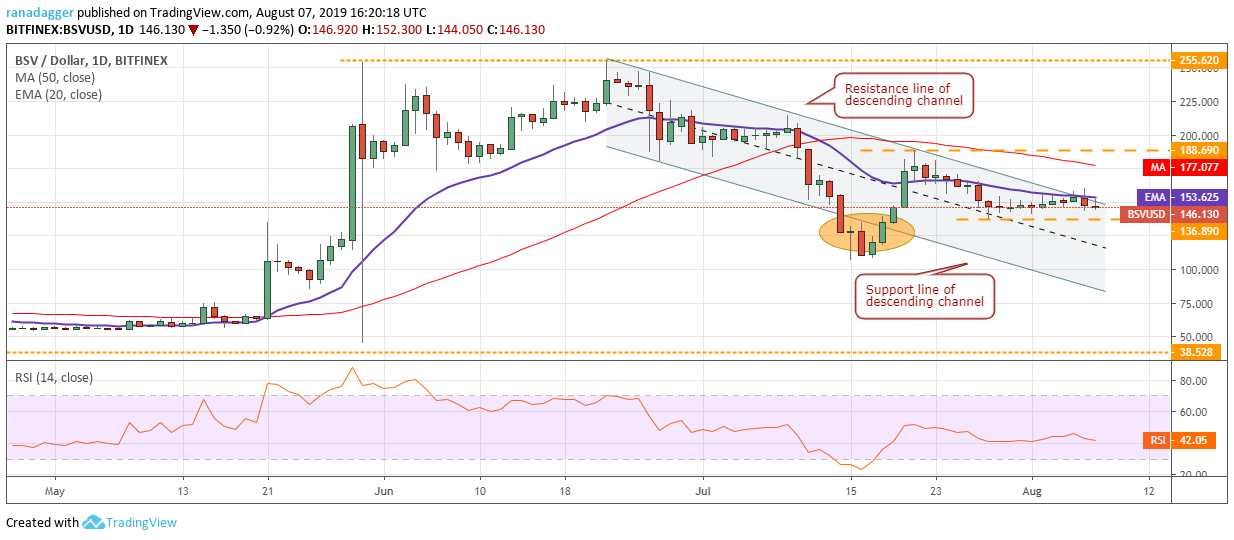
Though Bitcoin SV (BSV) rose above the descending channel on Aug. 6, it could not close above it. Therefore, our buy proposed in the previous analysis did not trigger. However, if the price stays above $136.890, we anticipate another attempt by the bulls to break out of the channel.
A breakout and close (UTC time frame) above $160.350 will indicate a likely change in trend. The next level to watch is $188.690 where the BSV/USD pair might face some resistance. Once this level is crossed, the probability of a rally to а lifetime high increases. Therefore, traders can buy on a close (UTC time frame) above $160.350 and keep a stop loss just below $136.890. Contrary to our assumption, if the pair breaks below the support at $136.890, it can dip to $107.
XMR/USD
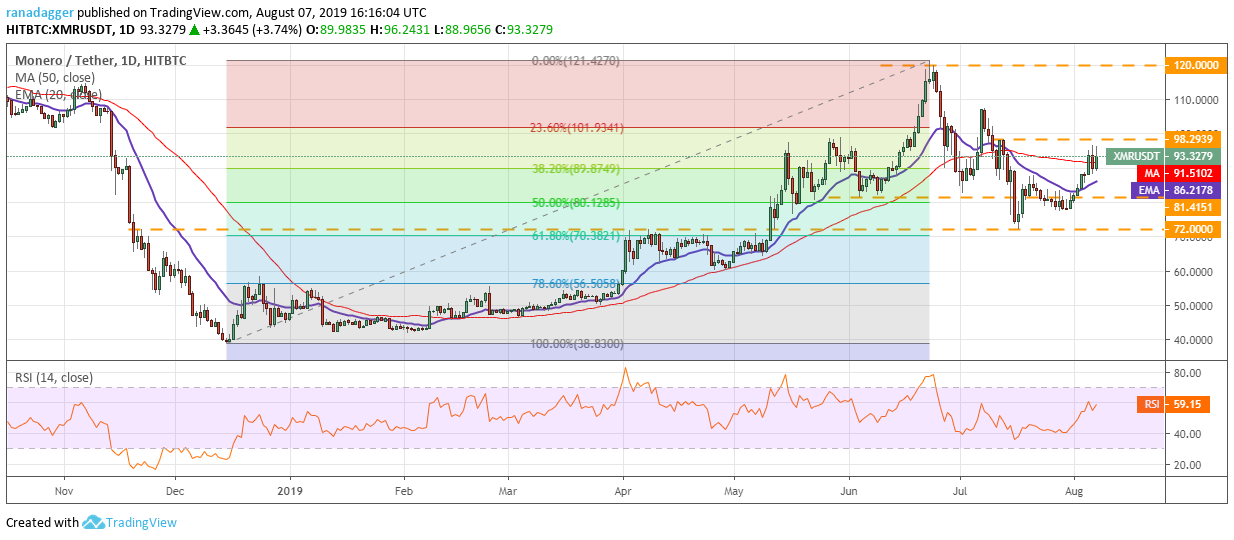
The recovery in Monero (XMR) hit a wall just below the minor resistance at $98.2939 on Aug. 6. However, the positive thing is that bulls are attempting to keep the price above the 50-day SMA. If successful, we anticipate another attempt to scale $98.2939, above which a rally to $107 is likely.
The 20-day EMA is sloping up and the RSI is in the positive zone, which suggests bulls have the advantage in the near term. Therefore, traders who initiated long positions on our recommendation given in the previous analysis can continue to hold with stops at $71. The first sign of a failed recovery will be if the XMR/USD pair dips below the 20-day EMA. If that happens, we might suggest closing the position or trailing stops higher. We will watch the price action for the next couple of days and then take a call.
XLM/USD
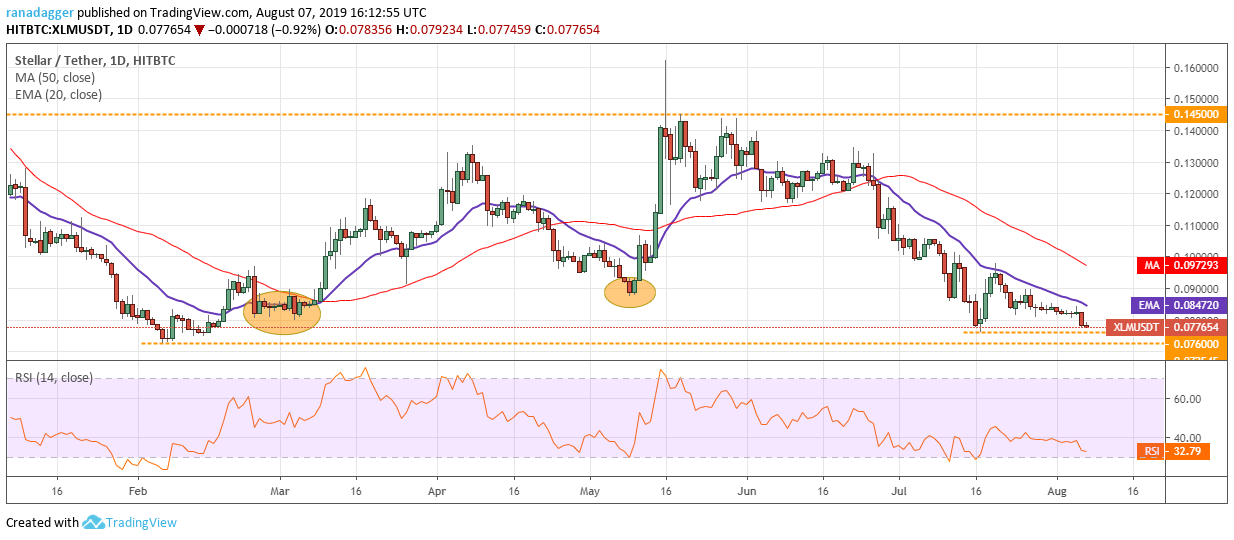
After the failed attempt to move up on Aug. 5, Stellar (XLM) has turned down. Both moving averages are sloping down and the RSI is in negative territory, which shows that bears have the upper hand. Our buy proposed in the previous analysis did not trigger, hence, we will withdraw it.
The bears will now try to sink the price below the $0.072545–$0.076 support zone. If successful, the pair will fall to new yearly lows, which is a huge negative. Our bearish view will be invalidated if the XLM/USD pair bounces off the support zone and climbs above both moving averages. Until then, we suggest traders remain on the sidelines.
Market data is provided by the HitBTC exchange.


