Bitcoin hit a new 2020 high and altcoins rallied as PayPal announced that it will support crypto payments.
The crypto markets are cheering PayPal’s decision to allow its customers to use cryptocurrencies to shop from its vast merchant network. PayPal also revealed that U.S. account holders will be able to buy, sell, and hold cryptocurrencies in the PayPal app.
The company plans to extend this service to a few other countries in the first half of 2021. PayPal’s decision has significantly increased the reach of cryptocurrencies. Now many of the company’s 346 million active users will have the options to engage with cryptocurrencies and become investors if they choose.
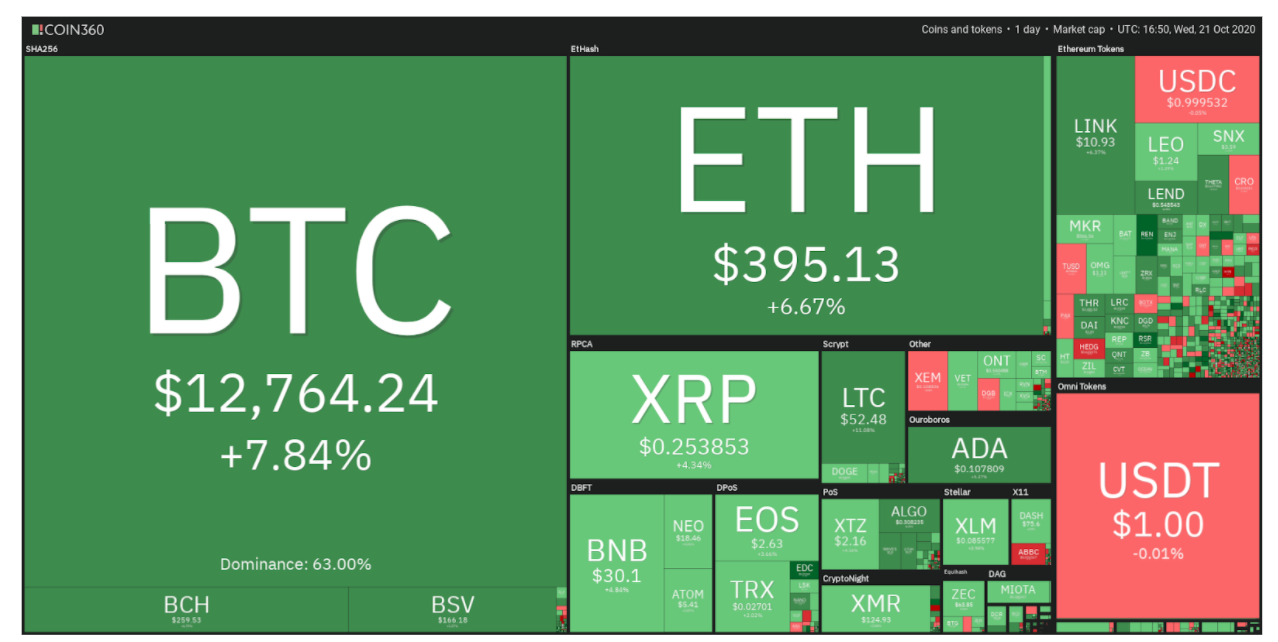
However, a mass influx of investors into cryptocurrencies is likely to take more time. Ultimately, this move by PayPal proves that companies cannot ignore the rise of digital assets anymore.
Although the news is bullish, a vertical rally may not materialize immediately. After the initial buying frenzy dies down, the extent of any future correction will confirm whether a new roaring bull market has begun or if institutional investors used this news to lighten up their positions in order to buy at lower levels.
Let’s analyze the charts of the top-10 cryptocurrencies and spot the critical levels to watch out for.
BTC/USD
Bitcoin (BTC) soared above the resistance line of the ascending channel on Oct. 20. That was followed by a sharp up-move today when the bulls propelled the price above the stiff overhead resistance at $12,460.
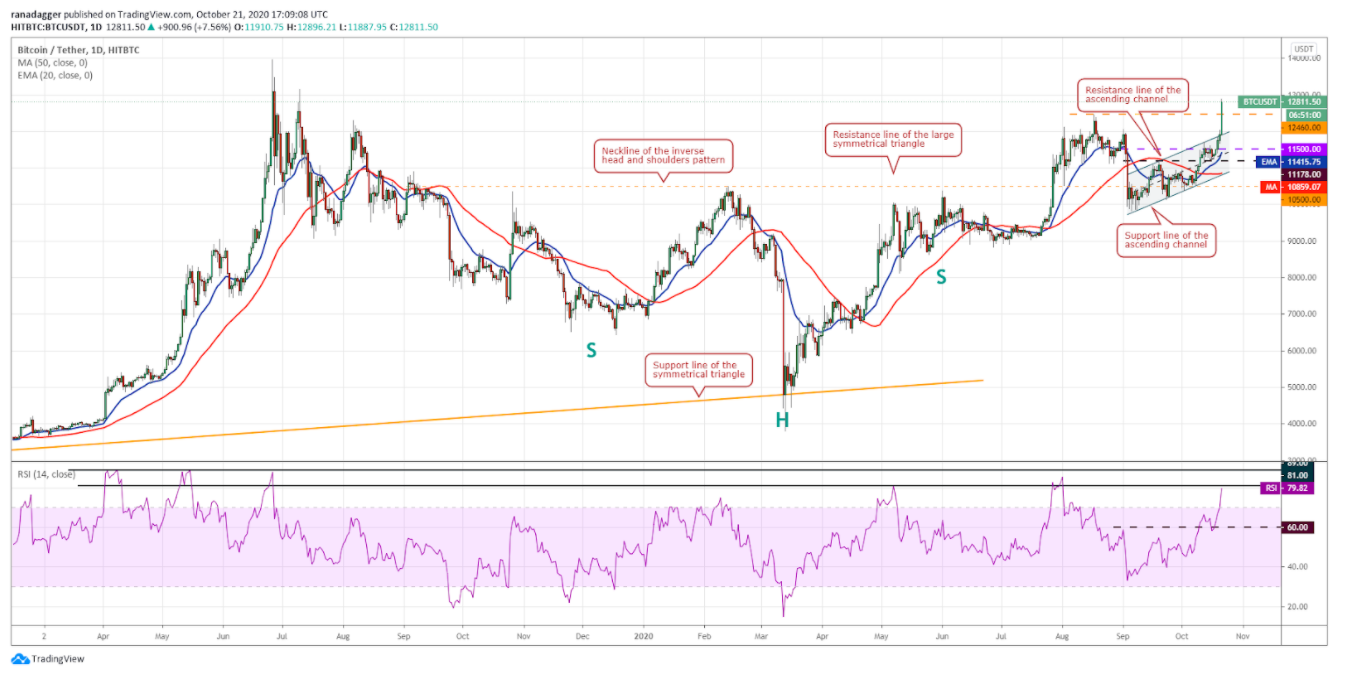
A new 52-week high is generally a bullish sign. The breakout of the ascending channel gives the BTC/USD pair a target objective of $12,975. If this level is crossed, the rally may extend to $14,000.
The current up-move has pushed the relative strength index to 80. Previous instances show that the risk of a correction increases when the RSI rises above 80.
The first sign of weakness will be a break and close (UTC time) below the previous resistance turned support at $12,000.
Conversely, if the bulls can arrest the next correction at $12,000, it will signal strength and increase the possibility of a resumption of the up-move.
ETH/USD
Ether (ETH) has held above the 20-day exponential moving average ($370) for the past few days. The failure of the bears to break this support has attracted buying from the aggressive bulls who are trying to sustain the price above the overhead resistance at $395.
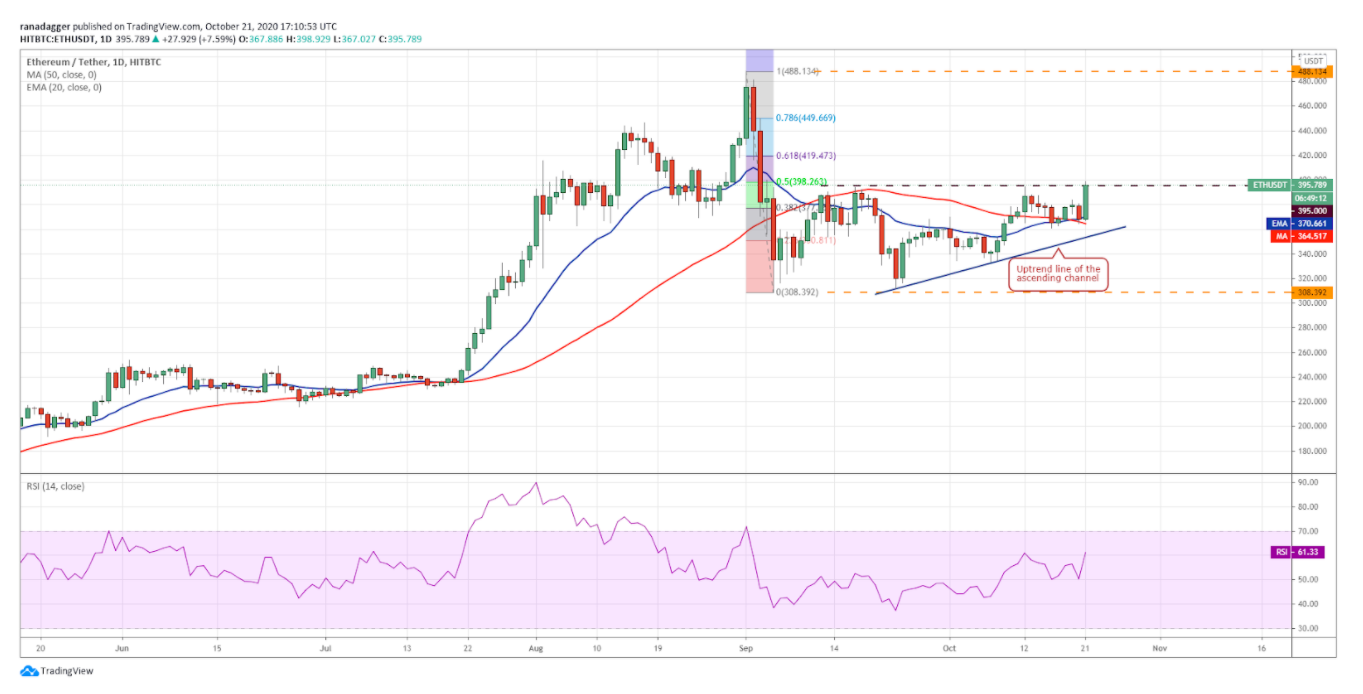
If they succeed, it will complete an ascending triangle pattern that has a target objective of $478. The gradually upsloping 20-day EMA and the RSI above 61 suggest a marginal advantage to the bulls.
However, the bears are unlikely to throw in the towel so easily. They will attempt to defend the overhead resistance at $395. If the ETH/USD pair turns down from the current levels and breaks below the uptrend line, it will signal weakness.
XRP/USD
XRP is currently range-bound between $0.26 and $0.2295. After failing to sustain above the moving averages for the past two days, the altcoin has made a decisive move higher today.
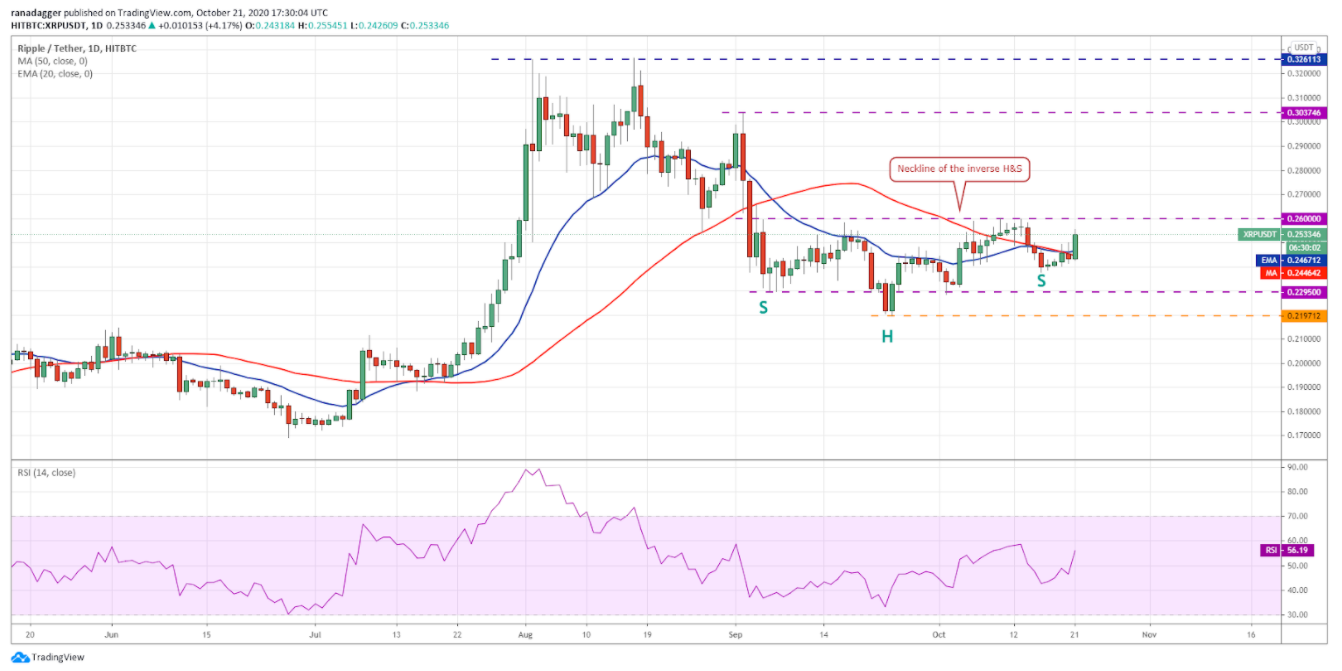
If the bulls can sustain the momentum and push the price above $0.26, the XRP/USD pair will complete an inverse head and shoulders pattern. This setup has a target objective of $0.30.
Contrary to this assumption, if the bulls fail to push the price above $0.26, the bears will again try to sink the price below the moving averages. If they succeed, the pair may extend its stay inside the range for a few more days.
BCH/USD
Bitcoin Cash (BCH) broke down and closed (UTC time) below the critical support at $242 on Oct. 20 but the bears could not capitalize on this weakness.
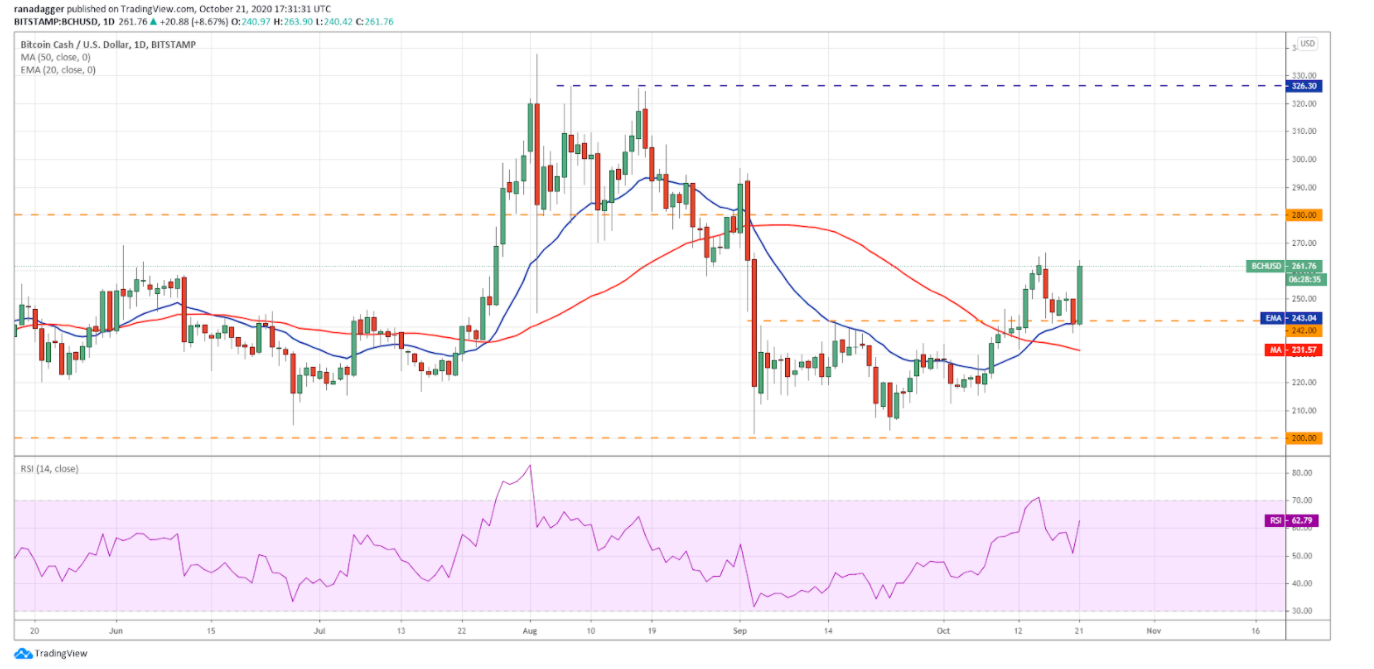
The BCH/USD pair has surged today, which shows strong buying by the bulls and short covering by the aggressive bears who may have opened short positions hoping for a fall to $200.
If the bulls can sustain the momentum and push the price above $266.46, the pair could rally to $280 and then to $300. The bounce in the RSI from 50 shows strength.
This positive view will be invalidated if the bears sell the current rally and sink the pair below the $237.69.
BNB/USD
Binance Coin (BNB) broke and closed (UTC time) below the $29.5646 support and the 20-day EMA ($29) on Oct. 21. However, the bears could not capitalize on this advantage and intensify the selling.
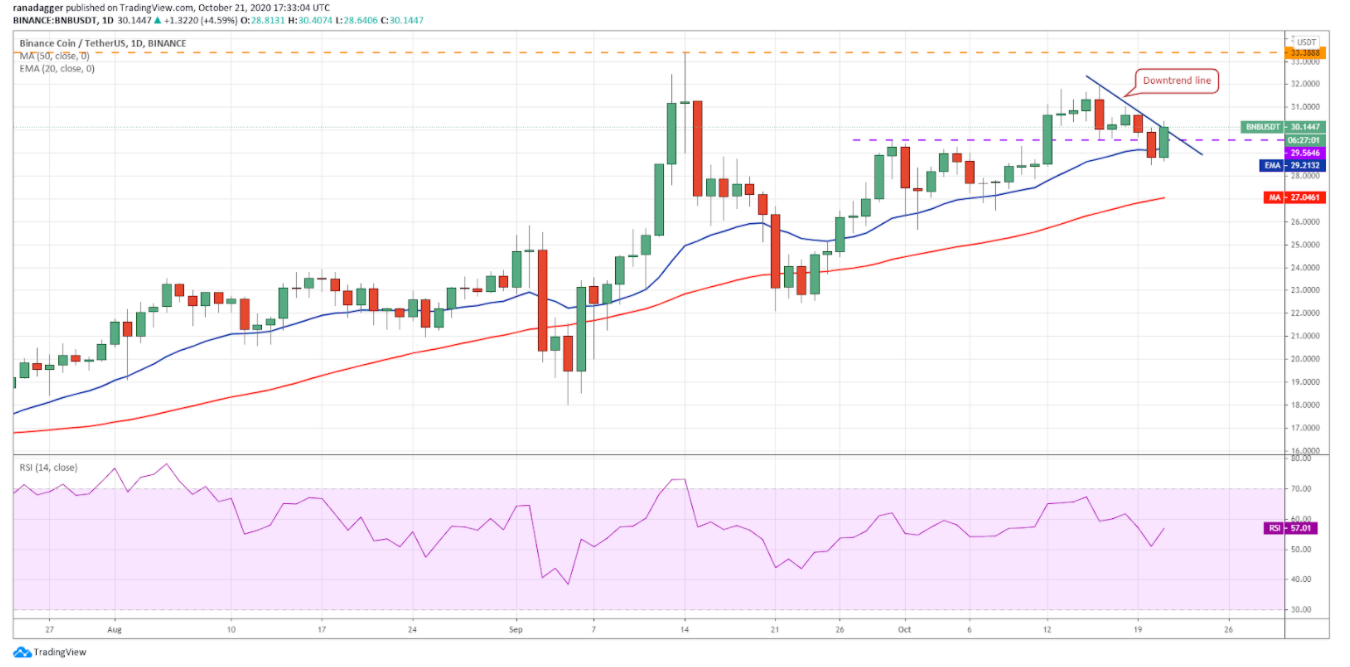
The bulls are currently attempting to push the price back above the downtrend line. If the BNB/USD pair closes (UTC time) above the downtrend line, a rally to $31.9798 and then to $33.3888 is possible.
Conversely, if the price turns down from the current levels, the bears will once again attempt to sink the pair below the 20-day EMA. If that happens, the pair could decline to the 50-day simple moving average ($27).
LINK/USD
Chainlink (LINK) turned down from the overhead resistance at $11.199 on Oct. 19 and plunged below the moving averages on Oct. 20.
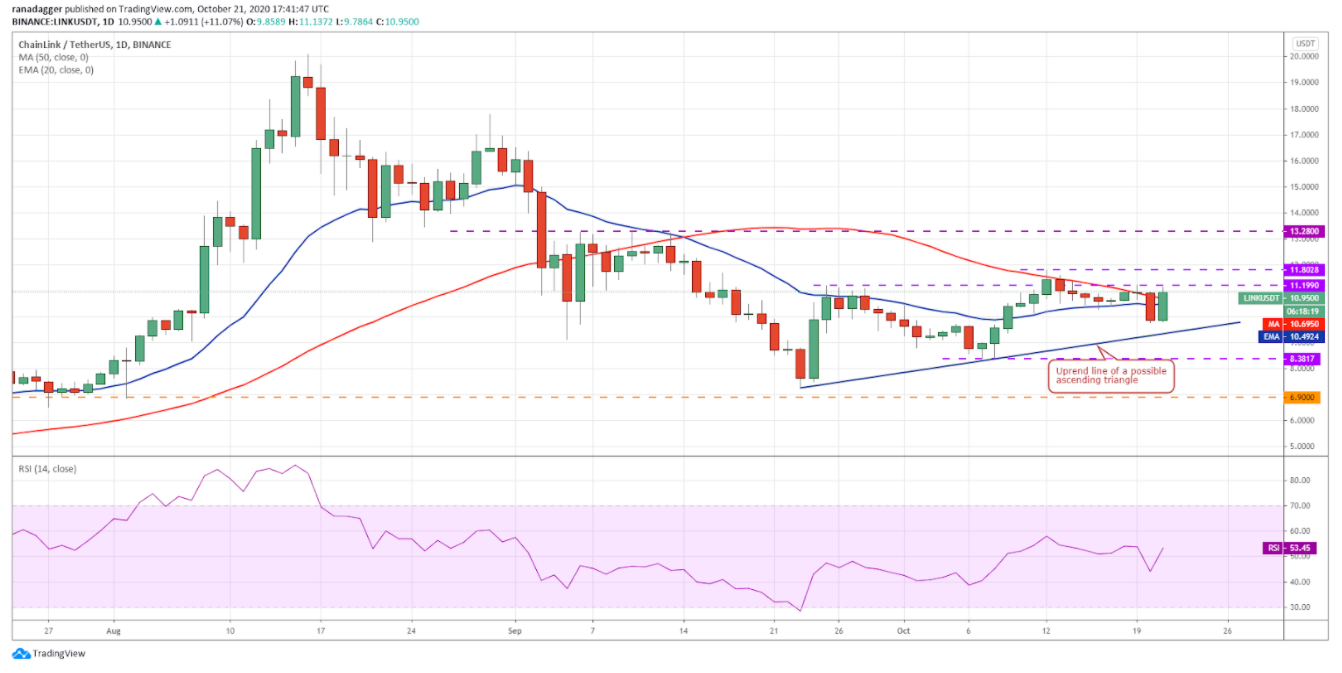
However, the bulls are not willing to surrender without a fight. They are currently attempting to push the price above the $11.199–$11.8029 overhead resistance zone.
If they succeed and the LINK/USD pair closes (UTC time) above the resistance zone, it will complete an ascending triangle pattern that has a target objective of $15.
On the contrary, if the pair once again turns down from the overhead resistance, the bears will try to sink the price below the uptrend line. If that happens, a decline to $8.3817 is possible.
DOT/USD
The bulls are struggling to push Polkadot (DOT) above the 20-day EMA ($4.14) and the bears are finding it difficult to sink the price below $3.80. This has kept the altcoin stuck inside a tight range.
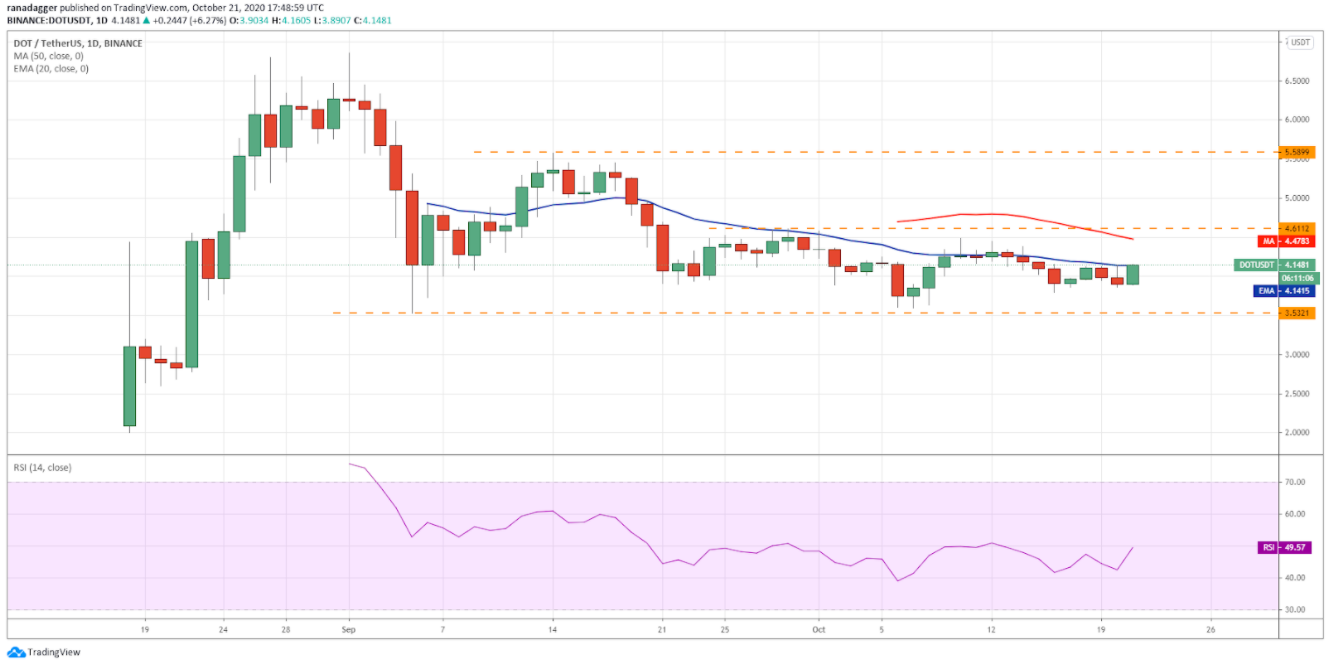
Usually, a squeeze is followed by expansion. If the bulls can push the price above the 20-day EMA, the DOT/USD pair could move up to $4.6112 and that could be followed by a rally to $5.5899.
The 20-day EMA has flattened out and the RSI has risen sharply to the midpoint. This suggests that the selling pressure has reduced.
However, if the price once again turns down from the overhead resistance and slips below $3.80, a retest of the $3.5321 is possible.
LTC/USD
Litecoin (LTC) price soared today and has reached the critical $51–$52.36 overhead resistance zone. If the altcoin can close (UTC time) above this zone, it will complete an inverse head and shoulders pattern.
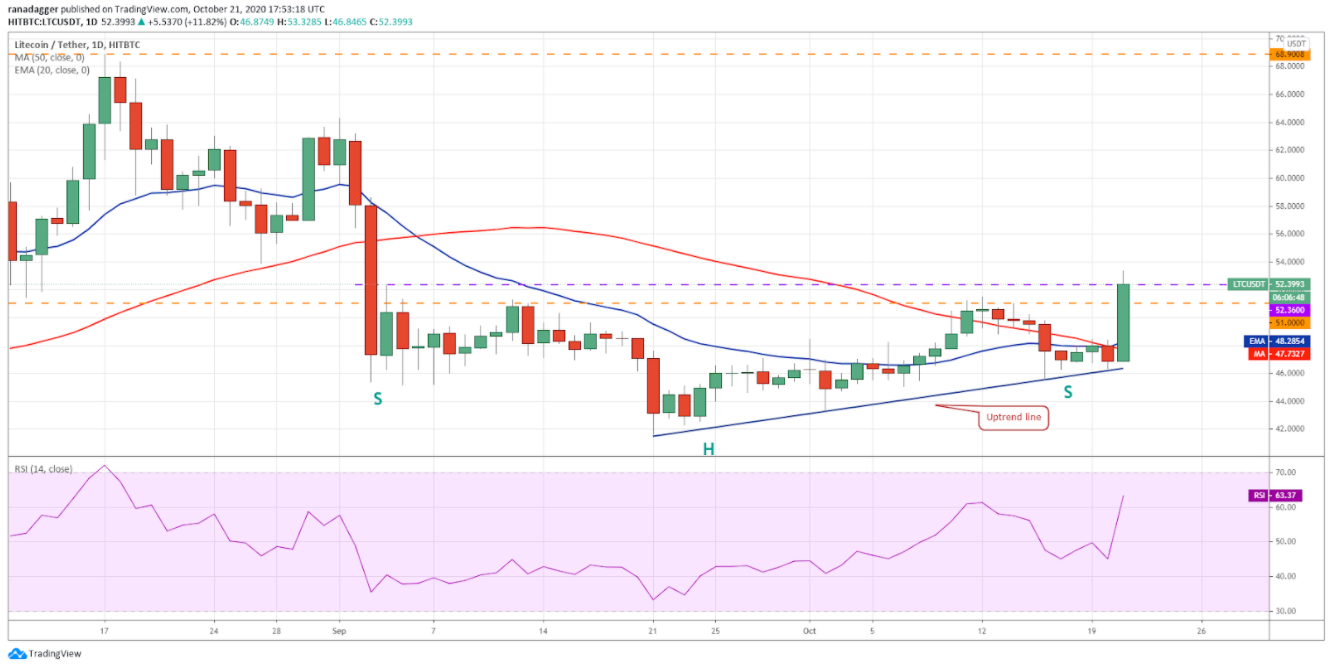
This bullish reversal pattern has a target objective of $61. The moving averages have completed a bullish crossover and the RSI has risen above 63, which suggests an advantage to the bulls.
However, the bears will pose a stiff challenge in the resistance zone. If the pullback from the current level is shallow, it will suggest that traders are not booking profits at the resistance and this will increase the possibility of the start of a new uptrend.
On the contrary, if the price turns down from the current levels and the bulls fail to arrest the decline above $50, the LTC/USD pair may again drop down to the moving averages.
ADA/USD
The bulls have once again purchased the dip to the support line of the rising wedge pattern. They will now try to push Cardano (ADA) to the resistance line of the wedge.
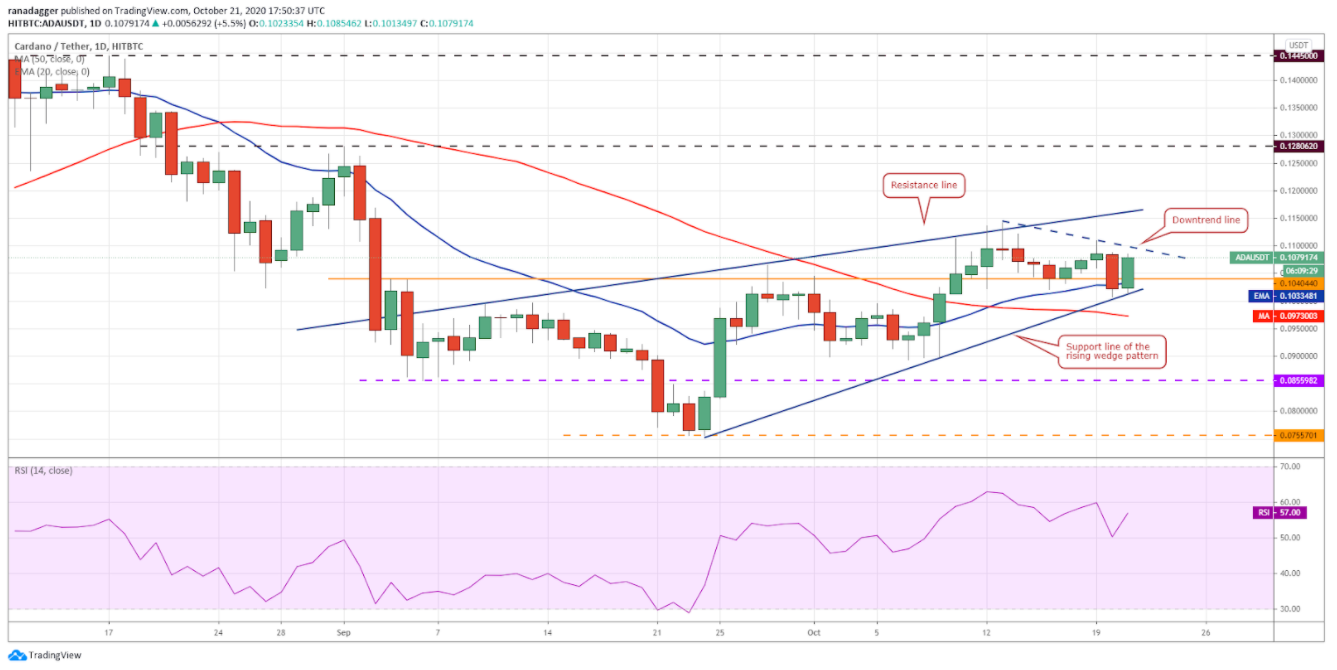
However, it is unlikely to be an easy task because the flat 20-day EMA ($0.10) and the RSI just above the midpoint suggest a balance between supply and demand. The bears will try to stall the recovery at the downtrend line.
If the price turns down from the overhead resistance, the bears will make one more attempt to drag the ADA/USD pair below the wedge.
On the other hand, if the bulls can push the price above the downtrend line, a move to the resistance line of the wedge is possible. A breakout of the wedge could start a new uptrend.
BSV/USD
Bitcoin SV (BSV) largely remains range-bound between $180.63 and $146.20. The bulls are currently attempting to sustain the price above the moving averages. If they can do that the altcoin could move up to the downtrend line and then to $180.63.
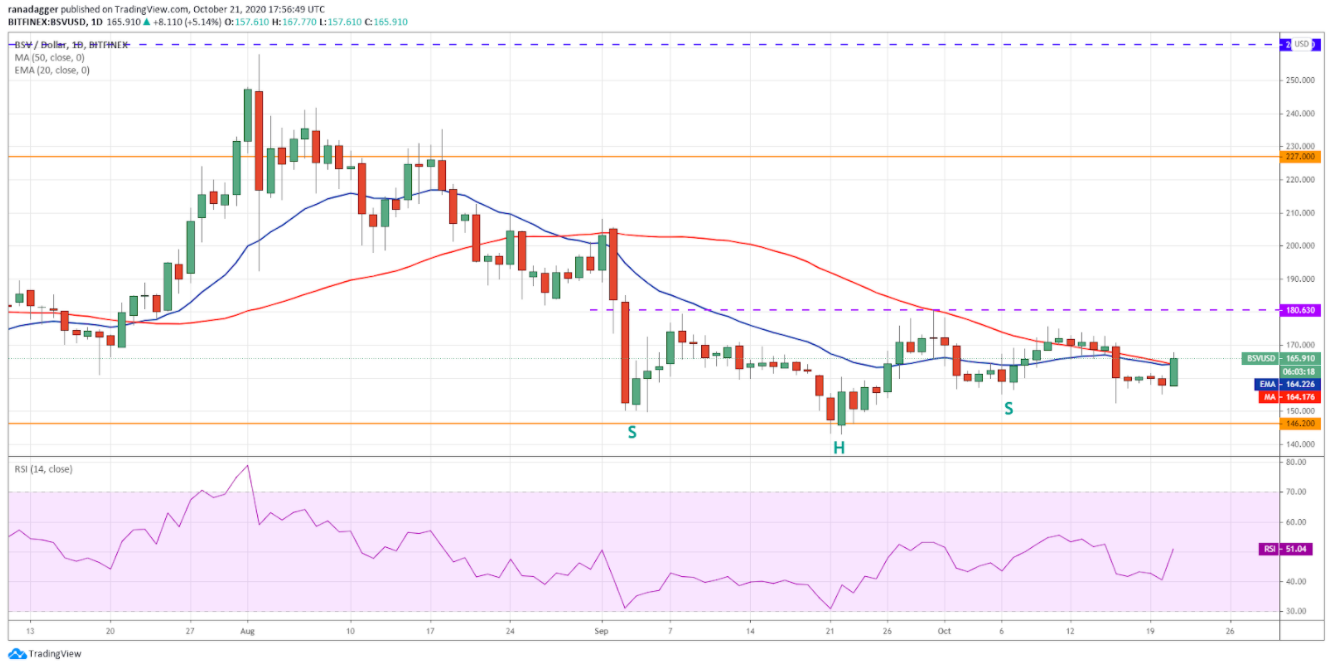
On the other hand, if the price turns down from the downtrend line, the bears will try to sink the BSV/USD pair to $146.20.
Currently, the flattish moving averages and the RSI close to the midpoint suggest a balance between supply and demand.
The next trending move could start after the bulls push the price above $180.63 or the bears break the support at $146.20. Until then, volatile range-bound action is likely to continue.
The views and opinions expressed here are solely those of the author and do not necessarily reflect the views of Cointelegraph. Every investment and trading move involves risk. You should conduct your own research when making a decision.
Market data is provided by HitBTC exchange.


