Will the launch of Bakkt boost Bitcoin prices? What do the charts project? Let’s analyze the charts.
The long-awaited launch of Bakkt has seen a lukewarm response as only 63 Bitcoin (BTC) contracts have been traded as of press time. This is not unexpected because Bitcoin has been range-bound for the past few weeks, hence, institutional traders will not be in a hurry to initiate positions. They are likely to wait and watch for a few days and then jump in.
Bakkt CEO Kelly Loeffler said that the launch of Bakkt will instill “trust through regulation and secure custody.” As the institutional players warm up to Bakkt, we anticipate volatility to pick up in the next few days and Bitcoin will start a trending move.
If Bitcoin prices plunge and start a down move, altcoins are unlikely to run in the opposite direction to start a new uptrend. But if Bitcoin remains range-bound or starts a new up-move, then select altcoins are likely to continue their outperformance. So, how should traders approach Bitcoin and altcoins? Let’s analyze the charts.
BTC/USD
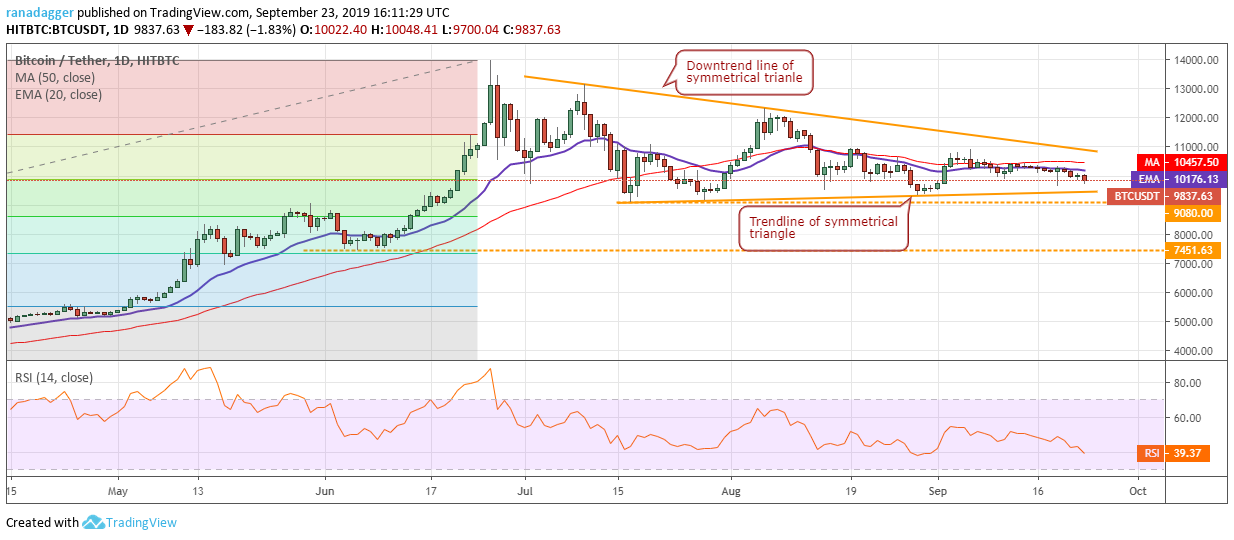
Bitcoin has been gradually losing ground, which is a negative sign. It can now drop to the trendline of the symmetrical triangle, which is an important support. A breakdown of the triangle and $9,080 will be a huge negative as it will trigger a number of stops and can result in a quick fall to the next support of $7,451.63. Such a fall will dent sentiment and is likely to delay the start of the next leg of the up-move.
Conversely, if the BTC/USD pair bounces off current levels or from the trendline support and breaks out of the triangle, it will attract traders who have been waiting on the sidelines for a trending move. With buyers jumping in, the pair is likely to quickly rally to the 52-week high of $13,973. Therefore, traders can initiate long positions as suggested in our earlier analysis.
ETH/USD
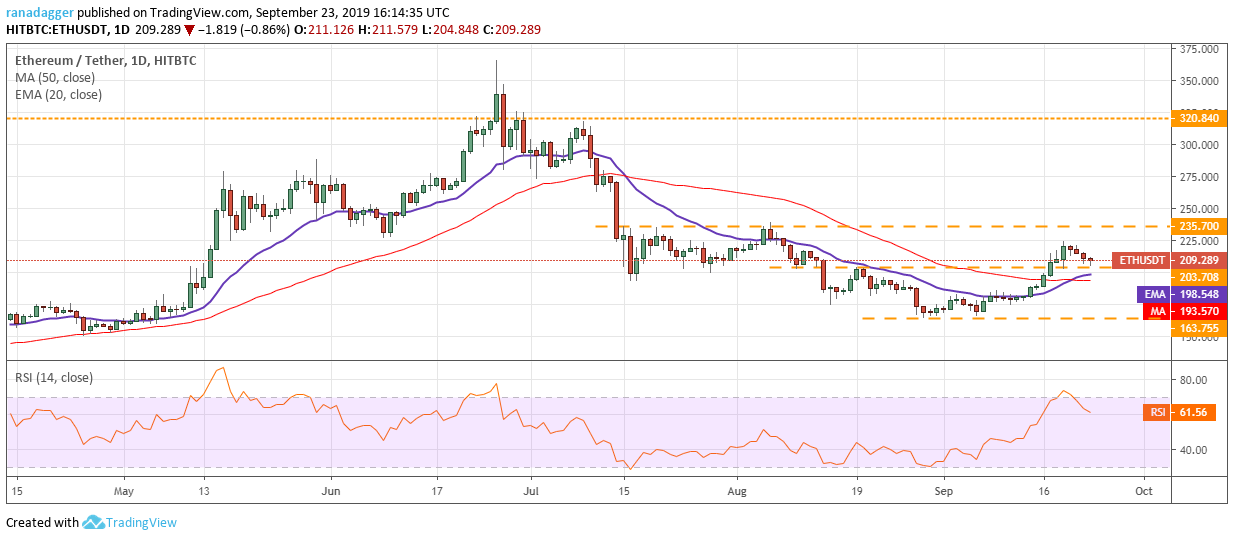
Ether (ETH) is retesting the breakout level of $203.708. The 20-day EMA is placed just below this, hence, we anticipate strong support at $203.708. A strong bounce from the current level can carry the price to $235.70, which will again act as a stiff resistance.
If the bulls can scale above $235.70, a rally to $320.84 is possible. The bullish crossover on the moving averages and the RSI in the positive zone shows that the advantage is with the bulls. Therefore, traders can continue to hold their long positions with stops at $160.
Our bullish view will be invalidated if the ETH/USD pair slips back below the moving averages. Such a move will indicate a lack of demand at higher levels and can result in a drop to the critical support of $163.755.
XRP/USD
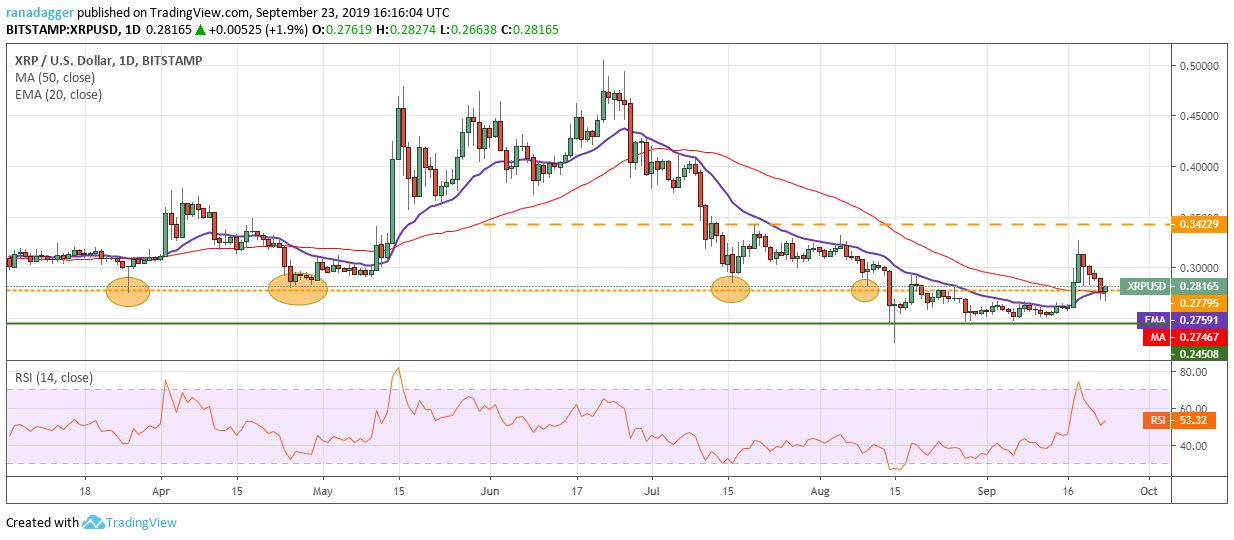
The pullback in XRP dipped below $0.27795 and triggered our buy recommendation given in the previous analysis. Currently, the bulls are attempting to hold the price above the moving averages. We would have liked to see a sharp bounce off $0.27795, but that has not happened. Both moving averages are flat and the RSI is just above the center, which shows a balance between buyers and sellers.
If the XRP/USD pair slips below the moving averages, it can correct to $0.24508. A breakdown of this level can drag the price down to the 52-week low of $0.225. Therefore, we suggest traders keep the stop loss on the long position at $0.240.
Conversely, if the pair bounces off current levels, it can move up to $0.34229. A breakout of this overhead resistance will be a huge positive that can carry the price to $0.40831.
BCH/USD
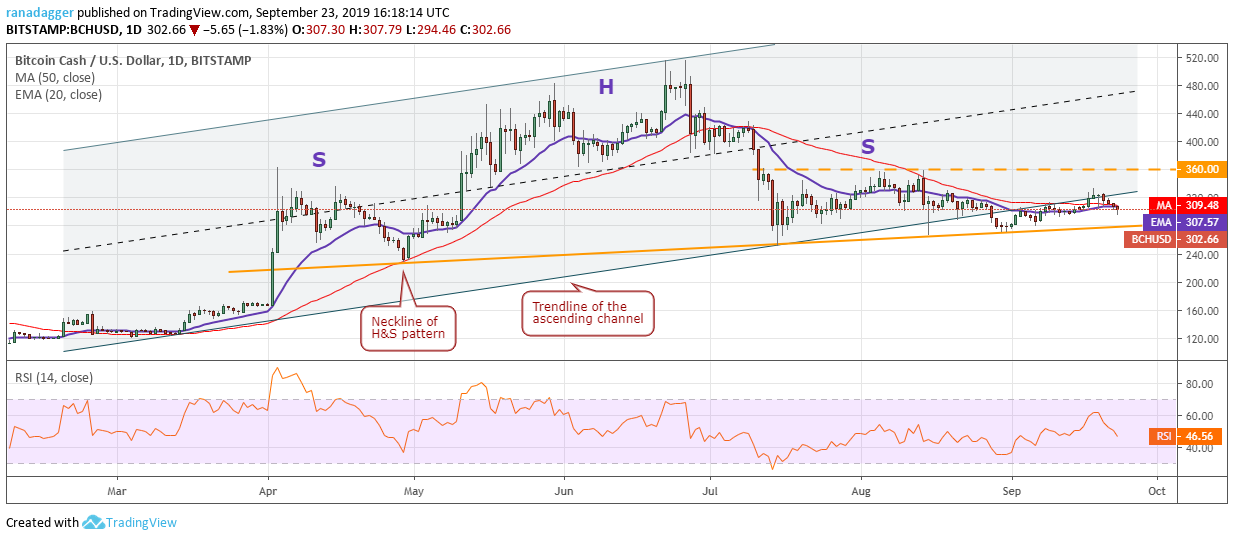
Bitcoin Cash (BCH) has dipped down to the moving averages, which have flattened out. The RSI is just below 50, which points to a range-bound action for a few days. If the price sustains below the moving averages, it can drop to the neckline of the head-and-shoulders pattern. This is an important support level because if it cracks and the price closes (UTC time) below it, the bearish pattern will complete, which will be a huge negative.
On the other hand, if the BCH/USD pair bounces off current levels, the bulls will again attempt to push it above the overhead resistance of $360. If successful, it is likely to start a new uptrend. We will suggest a long position after the price sustains above $360. Until then, we remain neutral on it.
LTC/USD
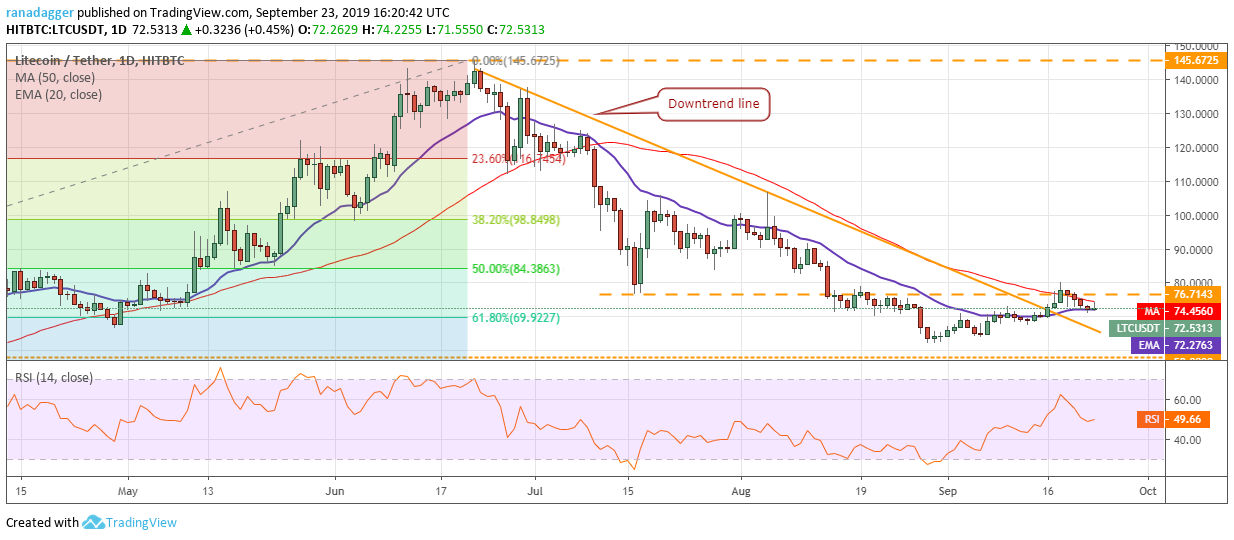
The bulls are struggling to keep Litecoin (LTC) above the 20-day EMA, which is a negative sign as it shows a lack of demand at these levels. If the price breaks down of the 20-day EMA, a drop to the critical support of $62.0764 is likely. A break below this support can sink the price to $58, hence, traders can keep the stop loss on the long position at $62.
The flattish moving averages and the RSI close to 50 points to balance between buyers and sellers. However, if the LTC/USD pair bounces off current levels and breaks out of $81, it is likely to pick up momentum and move up to $100.
EOS/USD
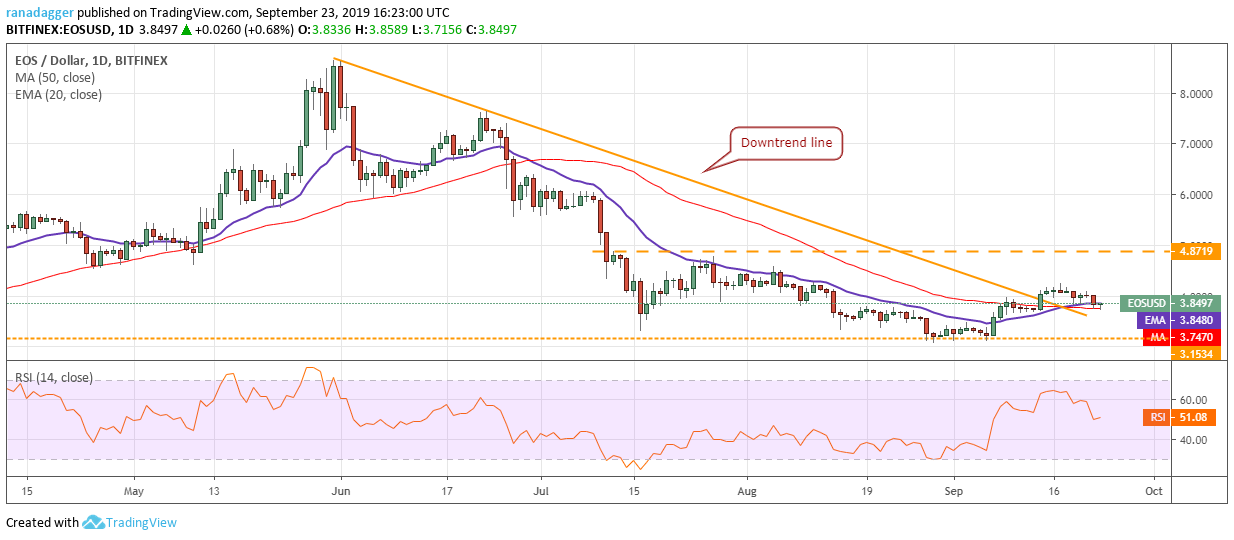
EOS has failed to take off after breaking out of the downtrend line, which shows a lack of demand at higher levels. Both moving averages have flattened out and the RSI has dipped to the midpoint. This shows that a few days of range-bound action is likely.
If the bears sink the price below the 50-day SMA, a drop to the critical support of $3.1534 is possible. A break down of this level will resume the downtrend. Therefore, traders can keep the stops on the long positions at $3.
However, if the EOS/USD pair bounces off current levels, it can move up to $4.8719. A breakout of this resistance will be a positive sign that can result in a rally to $6.
BNB/USD
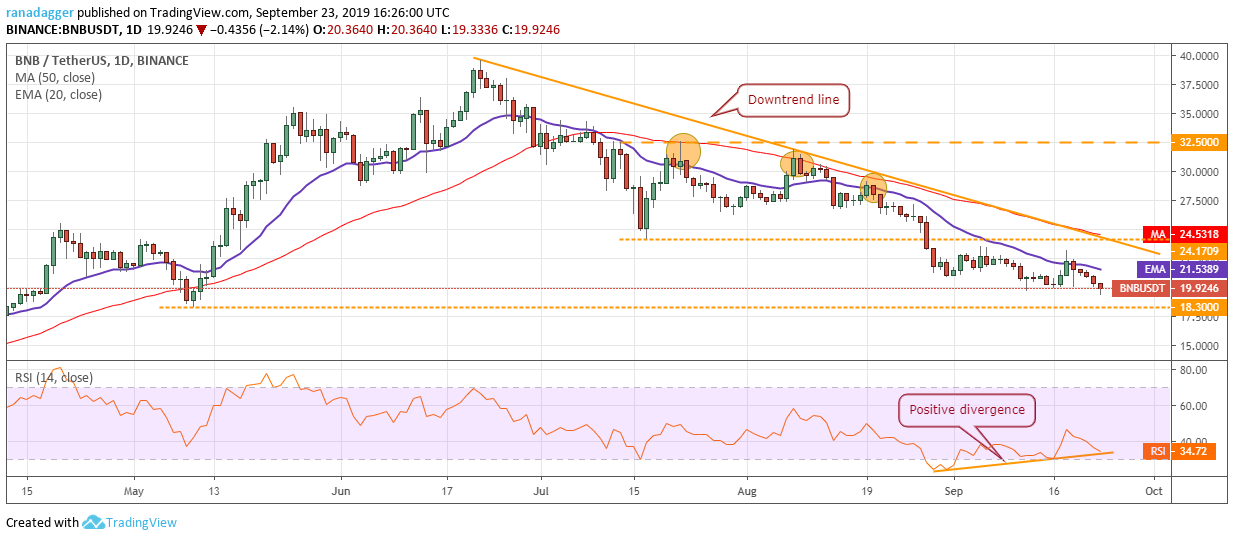
Binance Coin (BNB) has resumed its downward journey towards $18.30. Both moving averages are sloping down and the RSI is in the negative zone, which shows that bears are in command. If the bears sink the price below $18.30, a drop to $16.2501 is possible.
The only positive point on the chart is the bullish divergence on the RSI. However, in a downmove, without a confirmation from price, this is not a reliable setup to trade. As the bulls are struggling to push the BNB/USD pair above the 20-day EMA, we withdraw the buy recommendation given in an earlier analysis. We will suggest a long position once again after the price breaks out and sustains above the 50-day SMA.
BSV/USD
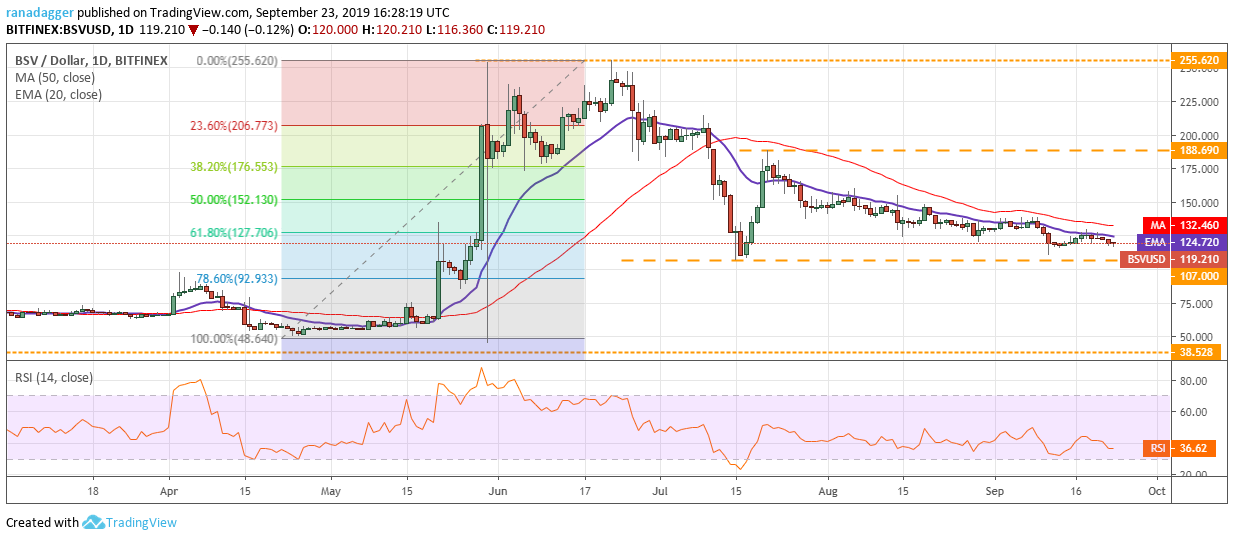
Bitcoin SV (BSV) has again turned down from the 20-day EMA, which is a bearish sign. Both moving averages are gradually sloping down and the RSI is in the negative territory, which shows that bears have a slight advantage.
The BSV/USD pair can now drop to the critical support of $107. If this level breaks down, the pair can drop to $92.933 and below it to $48.640. The pair will show the first signs of buying if the bulls can push the price above the moving averages. We do not find any reliable buy setups at current levels, hence, we are not suggesting a trade in it.
XLM/USD
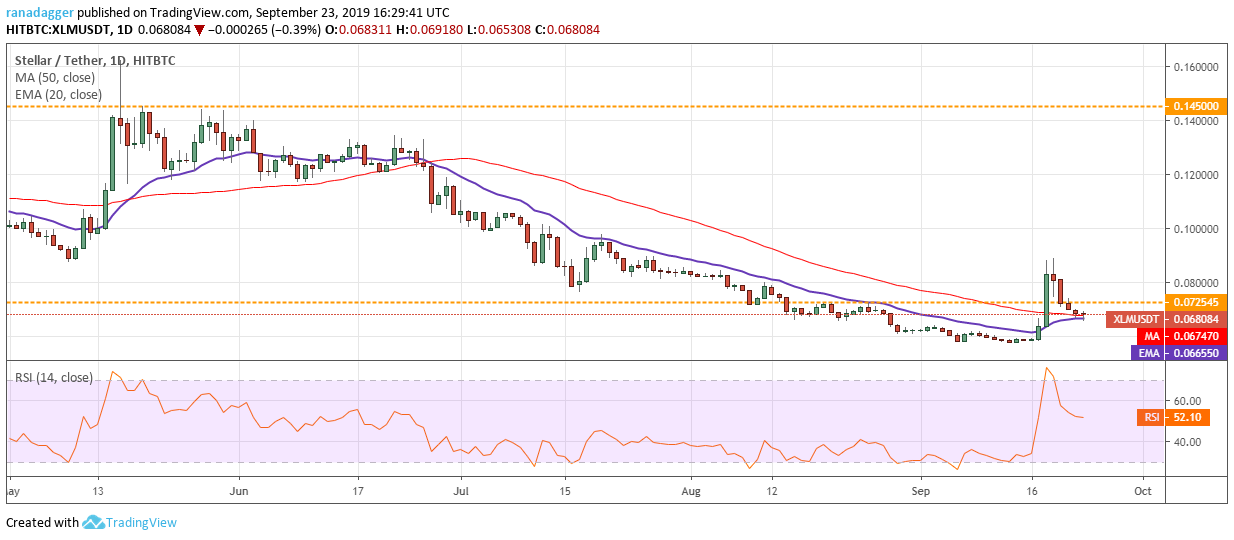
The pullback in Stellar (XLM) failed to hold above $0.073 for four hours, hence our buy recommended in the previous analysis did not trigger. Currently, the bulls are trying to stall the pullback at the moving averages, which have flattened out. The RSI has also dipped to the midpoint, which shows a balance between buyers and sellers.
If the XLM/USD pair rebounds off current levels, the bulls will again try to propel it above $0.072545. If successful, it will form a higher floor at $0.065. Traders can buy if the price sustains above $0.073 for four hours with a stop loss of $0.057. The first target will be a retest of $0.088708.
Conversely, if the XLM/USD pair dips below the moving averages, it can decline to the yearly low of $0.057722. If this support breaks down, the downtrend will resume.
ADA/USD
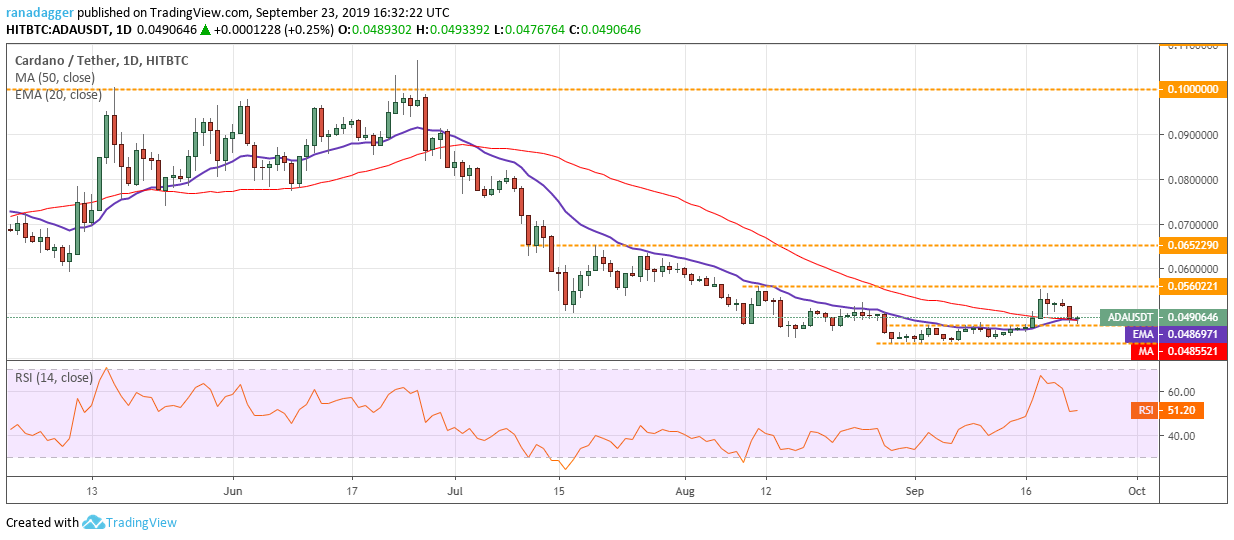
Cardano (ADA) has dipped to the previous resistance-turned-support of $0.047350. This is an important level to watch out for. If the price bounces off this support, the bulls will make another attempt to push the price above $0.0560221. If successful, a rally to $0.0652290 will be in the cards.
Conversely, if the ADA/USD pair breaks down of $0.047350, it will retest the critical support of $0.0433229. If this support breaks down, the downtrend will resume. Therefore, traders can keep the stop loss on the long position at $0.043.
The views and opinions expressed here are solely those of the author and do not necessarily reflect the views of Cointelegraph. Every investment and trading move involves risk. You should conduct your own research when making a decision.
Market data is provided by HitBTC exchange.


