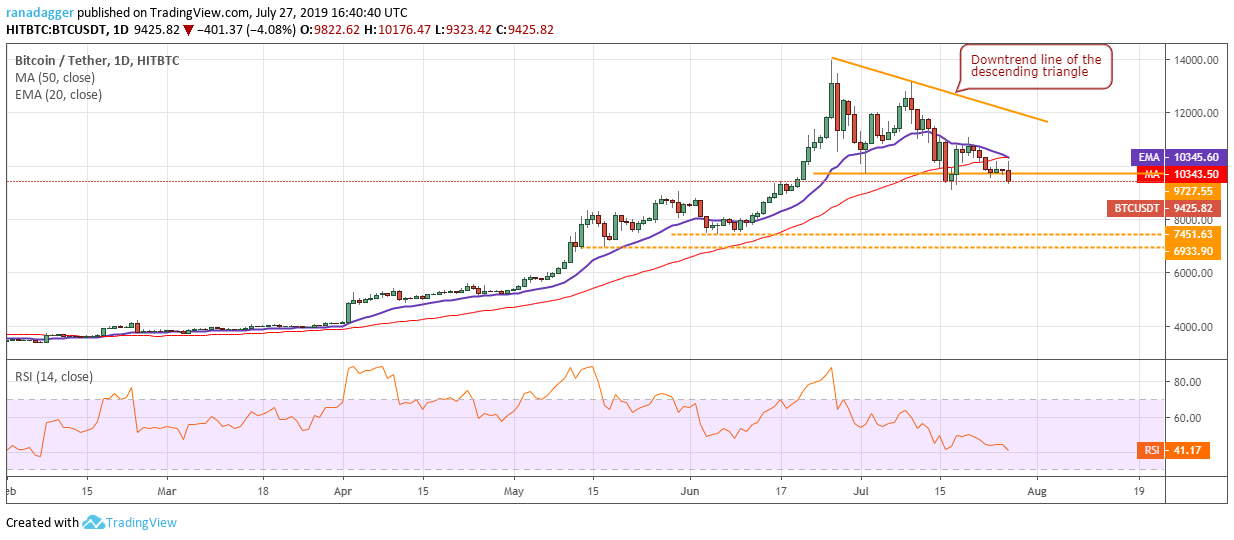
Bitcoin price is at a critical level. If the support cracks, it can result in a sharp fall to $7,450.
The views and opinions expressed here are solely those of the author and do not necessarily reflect the views of Cointelegraph. Every investment and trading move involves risk, you should conduct your own research when making a decision.
Market data is provided by the HitBTC exchange.
The sentiment in the crypto space is fragile. Even a whiff of negative news or rumor results in sharp selling. The markets are ignoring the favorable news and are focused on negative news and events. However, at lower levels, we expect the institutional players who had missed out on the previous rally to start buying once again.
The fundamentals are improving with both the European Central Bank and the US Fed indicating further rate cuts. We believe the launch of Bakkt’s futures platform will be a major sentiment booster and is likely to attract the institutional players once again. The hedge fund managers who have been early in the game are reaping rich benefits from including Bitcoin in their portfolio.
Bill Miller’s fund, which has diversified with Bitcoin has returned 46% in the first half of 2019.
With proper money management, these early adopters will generate huge returns and will force others to join or be left behind. Let’s see if we spot any buying opportunities after the recent fall.
BTC/USD
After staying above the support of $9,727.55 for the past three days, the bulls scaled $10,000 today. However, aggressive selling close to 20-day EMA resulted in a fall from $10,037.96 to $9,472.62 within 15 minutes. This shows that bears have the upper hand in the short-term.
The moving averages have completed a bearish crossover, which confirms a change in sentiment from buy on dips to sell on rallies. If Bitcoin (BTC) breaks down of $9,080, which is the intraday low of July 17, we expect selling to intensify and the price to fall to the next support zone of $6,933.90-$7,451.63.
However, even after the recent pullback, the BTC/USD pair is way above its yearly low of $3,236.09. Therefore, we consider the current fall to be a buying opportunity but the traders should wait for the correction to end and a bottom to form before buying.
Contrary to our assumption, if the price reverses direction from the support and rises above the moving averages, it will indicate strong demand at lower levels. In such a case, we might suggest long positions if the breakout sustains. Until then, we do not find any bullish setups that can be bought.
ETH/USD
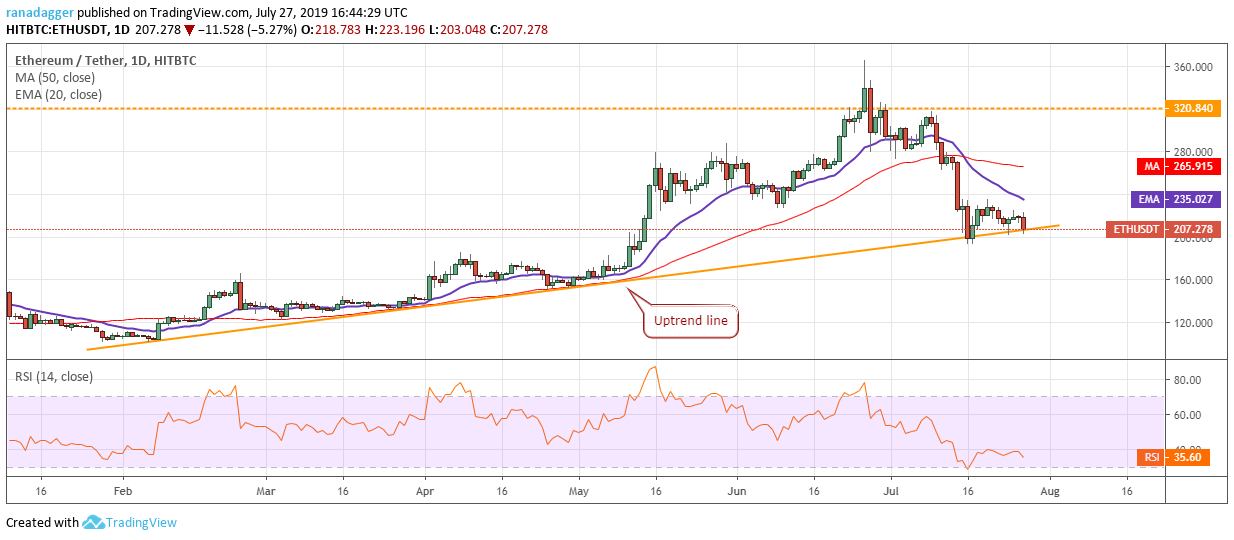
The bears are attempting to sink Ether (ETH) below the uptrend line. If successful, it can drop to $192.945, below which the fall can reach $150. The 20-day EMA is sloping down and the RSI continues to trade in the negative territory, which suggests that bears are in command.
Our bearish view will be negated if the ETH/USD pair turns around from the support levels and rises above the overhead resistance of $235.70. Such a move is likely to attract buyers and the price can move up to 50-day SMA and above it, a retest of $320.840 is probable. Therefore, we suggest traders remain on the sidelines until the price breaks out and closes (UTC time frame) above $235.70.
XRP/USD
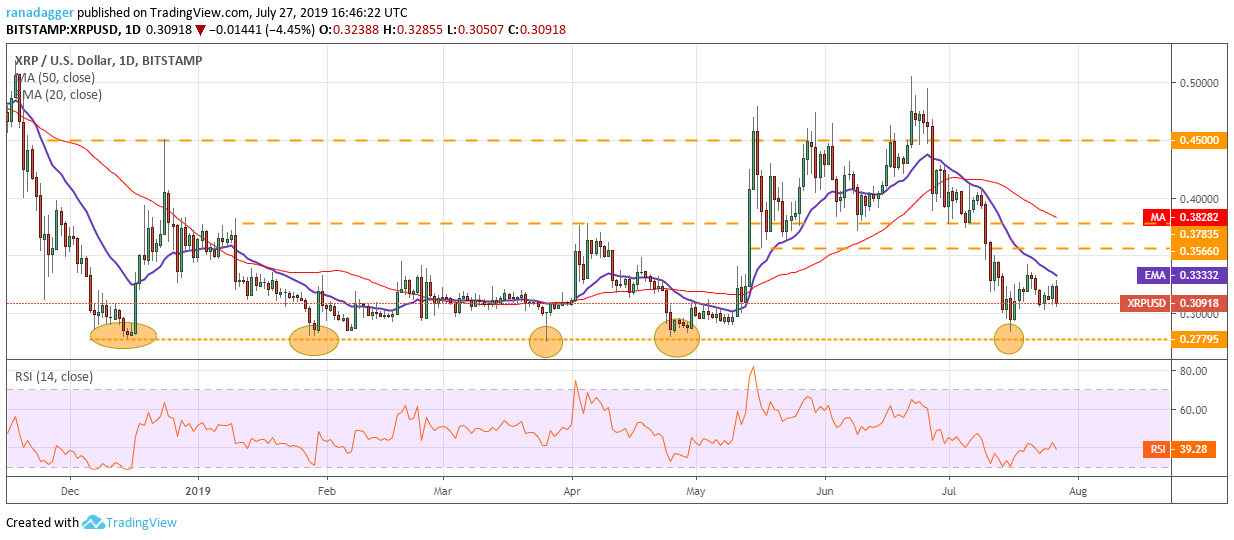
XRP has not been able to scale above 20-day EMA since falling below it on June 27. This is a negative sign. The price has again turned down from 20-day EMA and can now retest the critical support of $0.27795.
As this level has provided support on five previous occasions (marked via ellipses on the chart), a breakdown of it will trigger many stop losses. Though there is support at $0.25408, it might not hold and the XRP/USD pair can plunge to $0.19. Therefore, long-term traders who have established long position on our previous recommendation should keep the stop loss at $0.2750.
Nonetheless, if bulls defend the support level once again, the pair will try to remain inside the large range of $0.27795-$0.450. We do not find any reliable pattern for swing traders yet.
LTC/USD
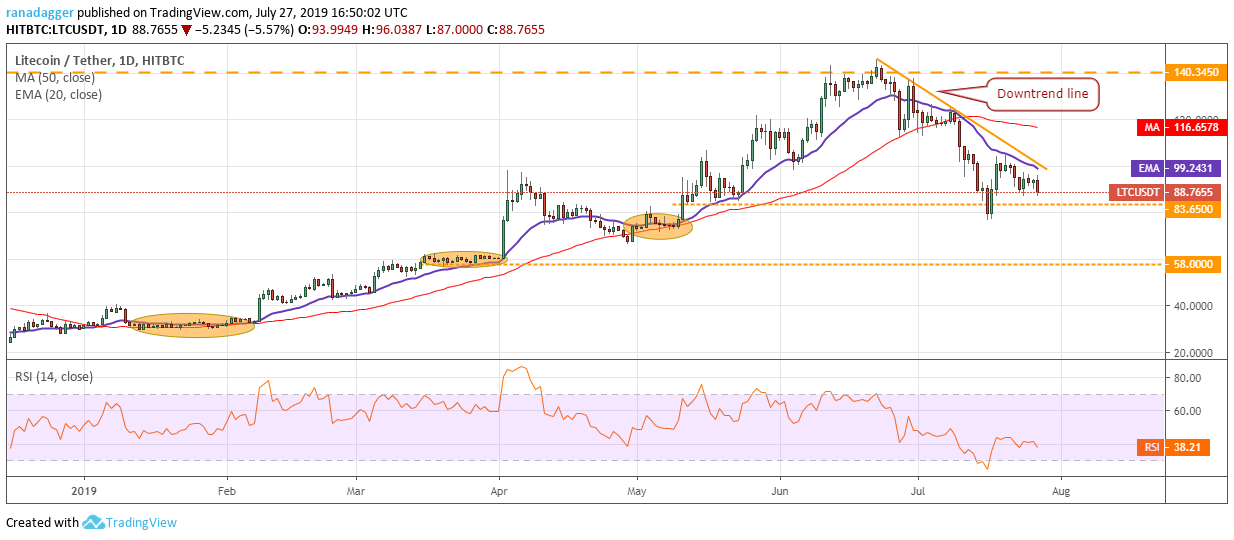
The bears are attempting to resume the downtrend in Litecoin (LTC). It can decline to $76.7143-$83.650 support zone. If bulls fail to defend this zone, the correction can deepen to $58, which is a strong support level.
Contrary to our expectation, if the LTC/USD pair bounces off the support zone and breaks out of the downtrend line, it will signal strength. Until then, we suggest traders avoid taking fresh positions because buying in a falling market can quickly turn the trade into a loser. The best time to buy is after the price signals a trend reversal.
BCH/USD
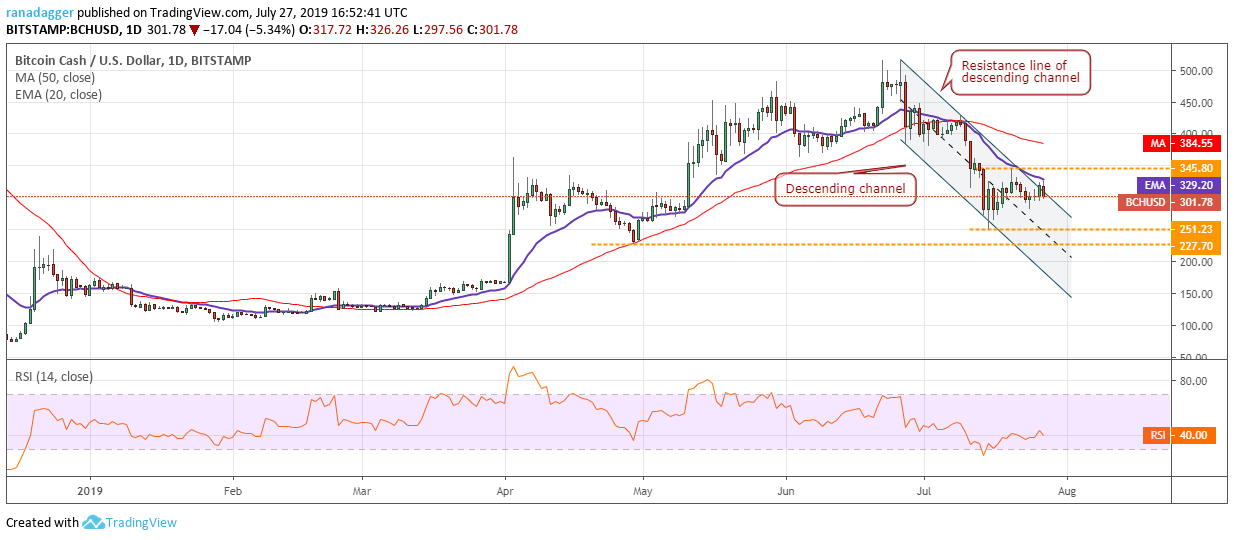
The bulls drove Bitcoin Cash (BCH) above the resistance line of the descending channel on July 26 but they could not scale above 20-day EMA. This attracted selling and the price has re-entered the channel, which is a bearish sign.
The BCH/USD pair can drop to $282 and if this support breaks, the next level to watch is $251.23. This is an important support and a drop below it will invalidate our view that the pair will trade inside $251.23-$345.80 range. We will have a clear picture in the next few days.
If the price quickly recovers and climbs back above 20-day EMA, it will suggest demand at lower levels. We will wait for the price to breakout of $435.80 before proposing a trade in it.
BNB/USD
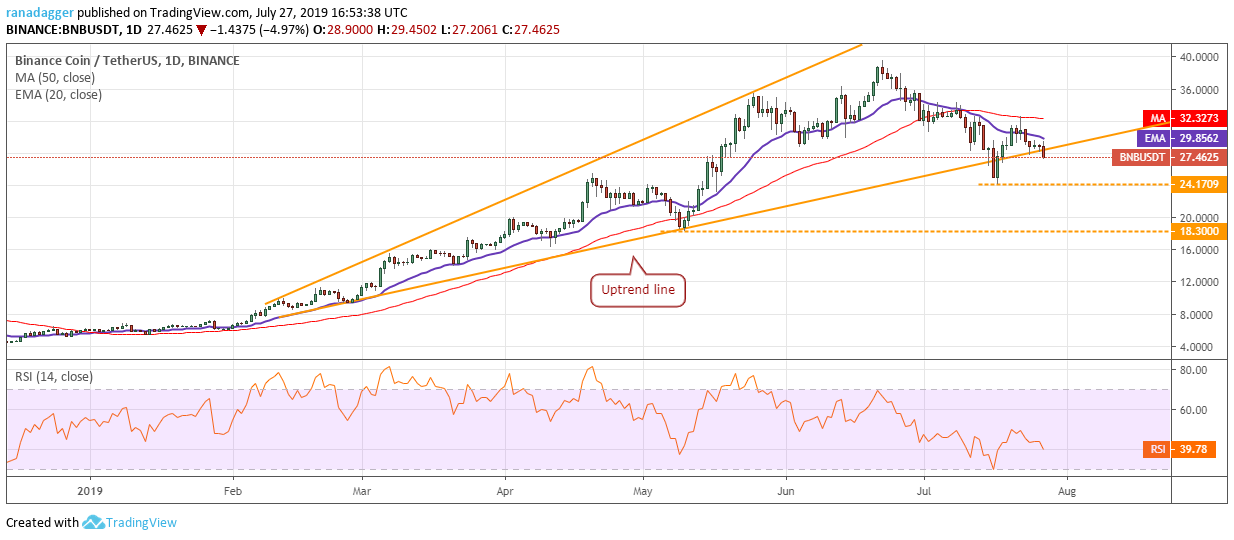
Binance Coin (BNB) has broken down of the uptrend line once again. Its next support is at $24.1709. If this support also breaks down, the fall can extend to $18.30. The 20-day EMA is trending down but the slope is not steep, which suggests that bears only have a minor advantage.
The BNB/USD pair has been a huge outperformer in the past few months. It has also corrected much lesser compared to other altcoins, which suggests that it is held by strong hands who expect the uptrend to resume. Therefore, we remain bullish on it and will recommend a long position as soon as we spot a trend reversal. Until then, we suggest traders remain on the sidelines.
EOS/USD
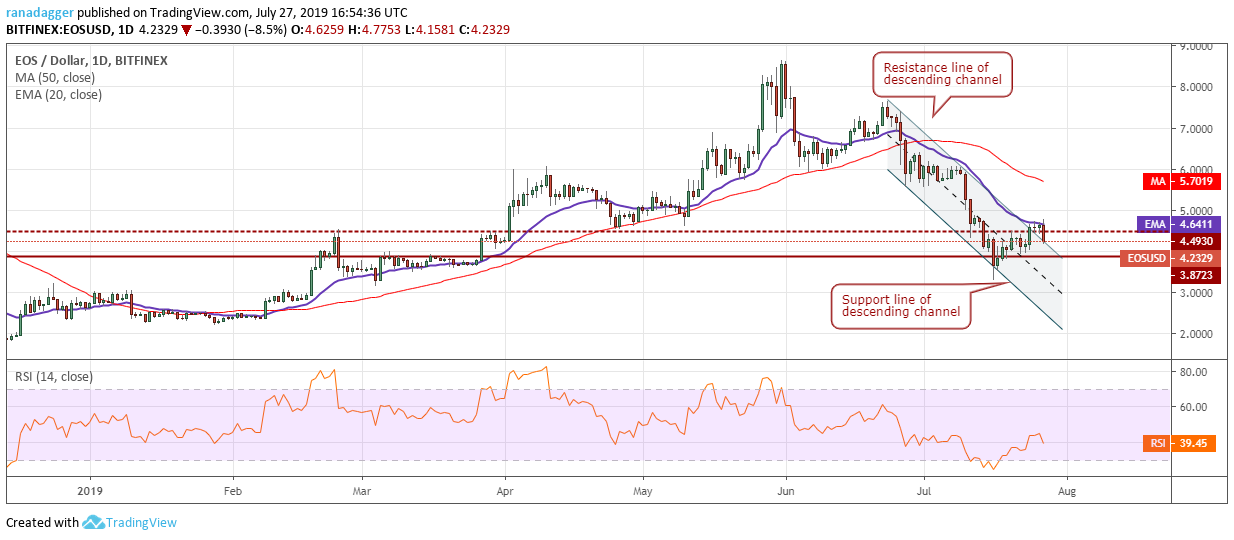
EOS could not breakout and sustain above 20-day EMA, hence, our buy recommended in the previous analysis did not trigger. A failure to scale above 20-day EMA has attracted selling.
The EOS/USD pair can now re-enter the channel, which is a bearish sign. There is a minor support at $3.8723, below which the drop can extend to the support line of the channel.
Contrary to our assumption, if the price rebounds off $3.8723 and rises above $4.9, it will indicate demand at lower levels. We will wait for the price to signal a turn around before recommending a trade in it.
BSV/USD
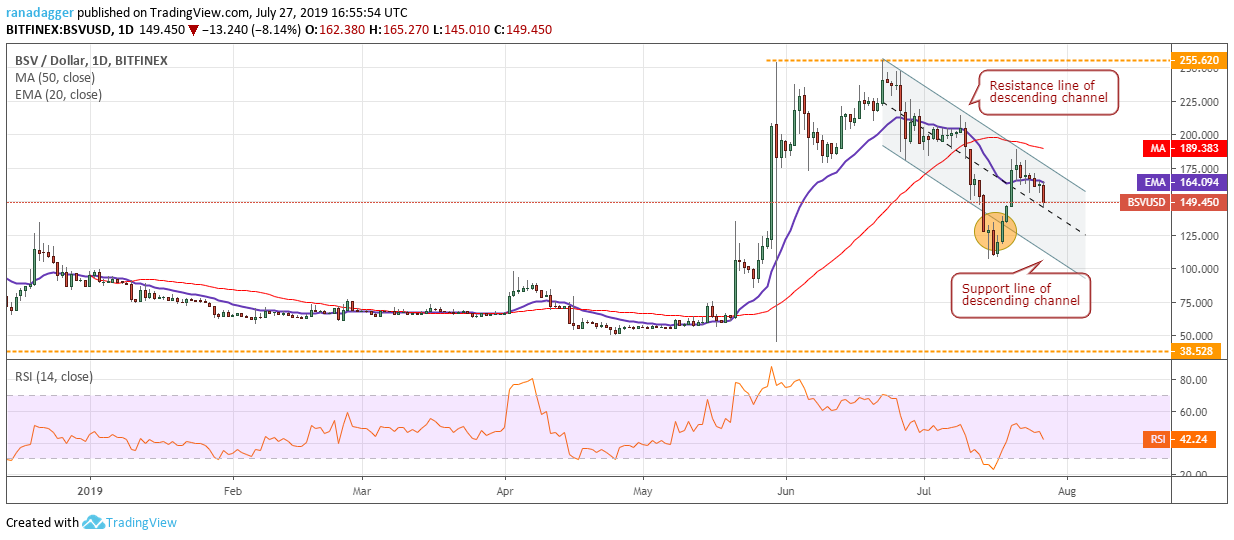
The path of least resistance in a downtrend is to the downside. After trying to hold above 20-day EMA for the past few days, Bitcoin SV (BSV) plunged below it. This shows renewed selling. The bears have the upper hand as long as the price remains inside the descending channel.
Currently, bulls are trying to keep the price in the upper half of the channel. However, if the BSV/USD pair does not bounce quickly, it is at risk of falling to the support line of the channel, which is close to the recent lows of $107. The pair will signal a change in trend only after it breaks out of the channel and sustains it. Until then, we remain neutral on the pair.
XLM/USD
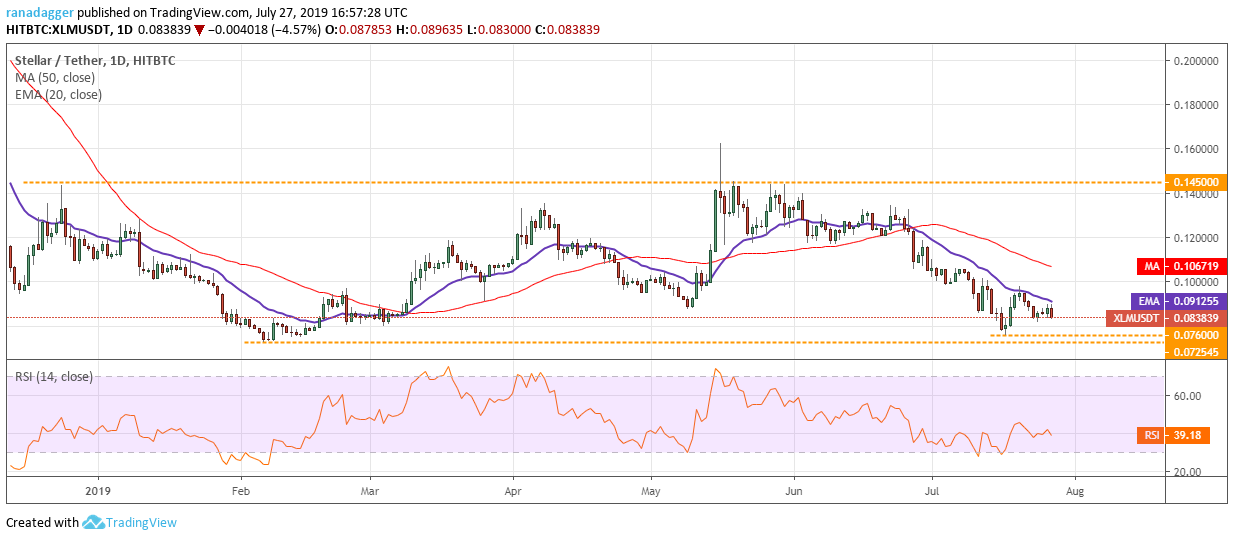
Stellar (XLM) is facing selling at 20-day EMA. It can now drop to $0.072545-$0.076 support zone. This is a critical zone because below this, the cryptocurrency will fall to new yearly lows, which will signal the start of a new downtrend.
A new yearly low when most other major cryptocurrencies are still way above their lows shows underperformance. The downtrending moving averages and RSI below 50 suggests that bears are in control.
Our view will be invalidated if the price rebounds off the support zone and climbs above $0.097795. That will increase the possibility of the XLM/USD pair staying inside the range. As the price is quoting close to the yearly lows, we are not suggesting a trade in it.
ADA/USD
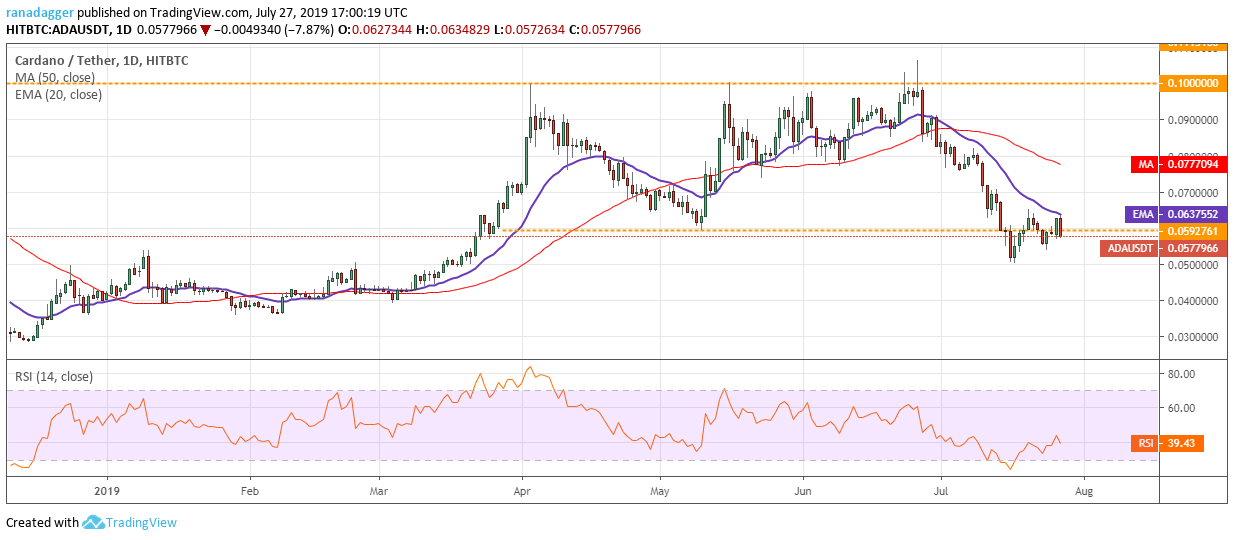
The pullback in Cardano (ADA) hit a wall at 20-day EMA. Both moving averages are trending down and RSI is in the negative zone, which suggests that bears have the upper hand. If the price now plummets below the recent low of $0.0501579, it can drop to the next support zone of $0.036-$0.039.
However, if the support at $0.0501579 holds, bulls will again try to push the price back above 20-day EMA. If successful, a rally to 50-day SMA and above it to $0.10 is probable. Therefore, we retain the buy recommendation given in our previous analysis.
Though the trend in the ADA/USD pair is down, we are suggesting a buy because if bears cannot capitalize on the breakdown below the support of $0.0592761, it shows buying at lower levels. The traders who have closed their long positions will be forced to get back in if the price sustains above 20-day EMA.
Market data is provided by the HitBTC exchange.


