Will volatility in cryptocurrencies pick up after the Fed’s announcement today? What are the critical levels to watch out for?
The views and opinions expressed here are solely those of the author and do not necessarily reflect the views of Cointelegraph. Every investment and trading move involves risk, you should conduct your own research when making a decision.
Market data is provided by the HitBTC exchange.
The United States Federal Reserve cut rates today for the first time since 2008, which some believe is unwarranted as the economy is on strong footing. The rate slash is seen by some as a means to appease President Donald Trump, who has been critical of the Fed’s monetary policy.
The rate cut could attract investors to Bitcoin, which is not influenced by any political or central bank intervention. With its halving due in 2020, markets will also focus on the deflationary nature of Bitcoin.
On Tuesday, U.S. Senate Banking Committee Chairman Michael Crapo said that even if the country wanted to ban cryptocurrency, it was unlikely to succeed. Circle CEO Jeremy Allaire said that the U.S. will need to create appropriate regulation to protect investor interests and “to allow the technology and industry to flourish.”
It will be interesting to note how Bitcoin and altcoins react to the Fed rate cut. Let’s identify the actionable levels on the major cryptocurrencies.
BTC/USD
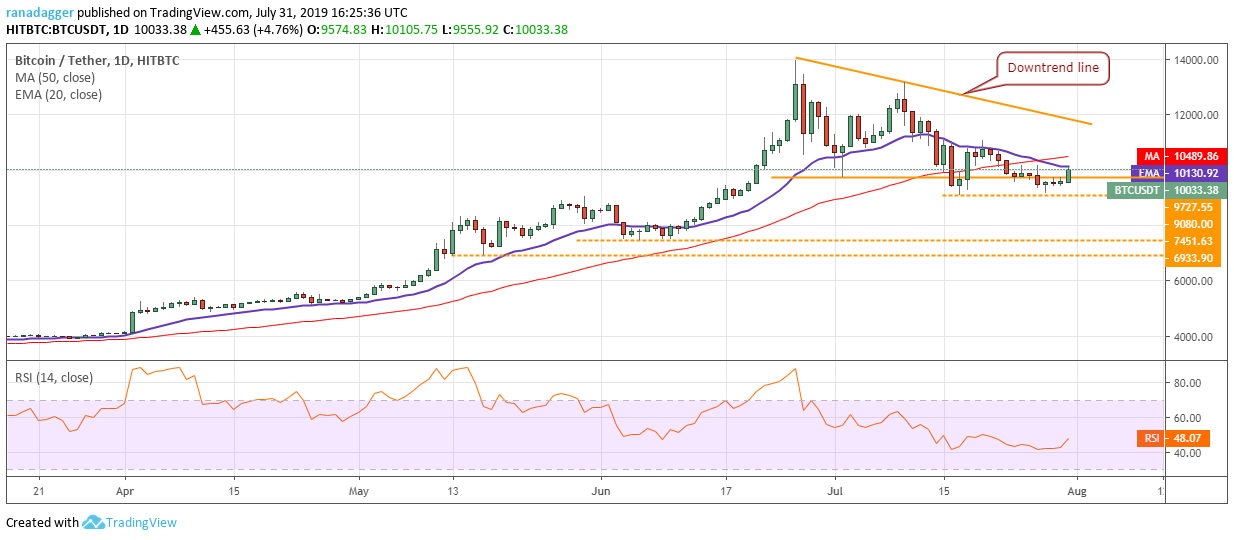
The failure by bears to sink Bitcoin (BTC) below $9,080 is attracting buyers. The bulls will now try to propel the price above both moving averages and resume the uptrend. If successful, the cryptocurrency will move up to the downtrend line, which might act as a resistance. However, if this line is scaled, the next target is a retest of the recent highs at $13,973.5. As the signs are positive, we suggest traders initiate long positions as recommended in an earlier analysis.
The 20-day EMA has started to flatten out, which suggests that bears are losing their grip. The 50-day SMA is still sloping up, which shows that the medium-term trend is up. Our bullish view will be negated if the BTC/USD pair turns down from the moving averages and plummets below $9,080. Such a move will indicate selling at higher levels. Below $9,080, the next support is at $7,451.63.
ETH/USD
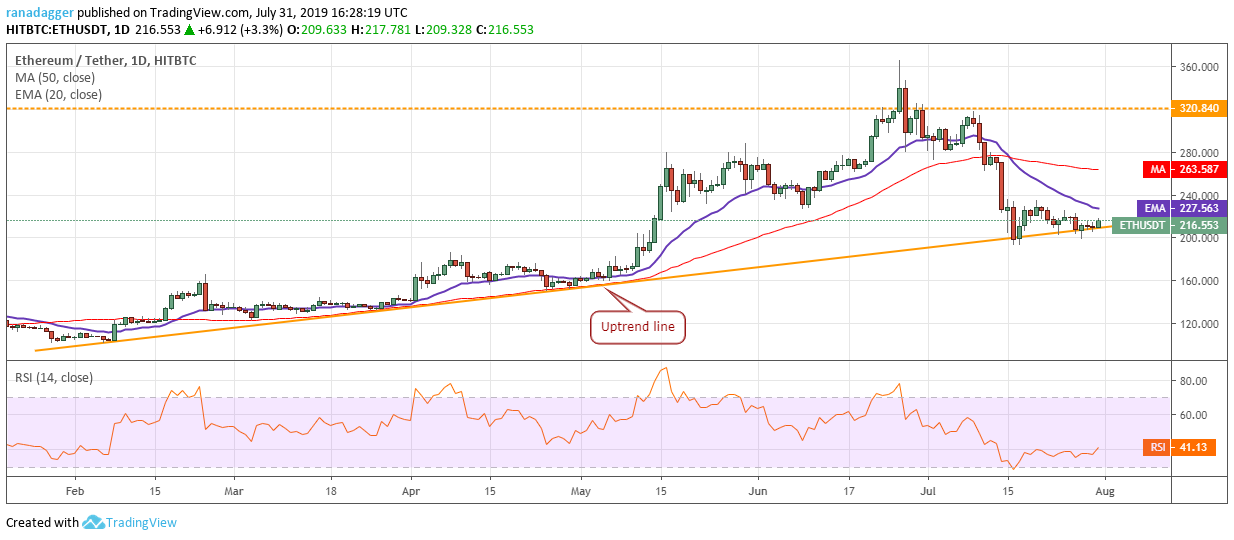
After holding the uptrend line for the past few days, Ether (ETH) has started a recovery. The bulls will now try to push the price above the 20-day EMA. If successful, a rally to the 50-day SMA is probable. There is minor resistance at $235.70, above which the digital currency is likely to gain strength. Hence, traders can buy as suggested in our earlier analysis.
Contrary to our expectation, if the ETH/USD pair fails to rise above the overhead resistance and turns down, it will indicate selling at higher levels. The next dip might break below the uptrend line because it will force the aggressive bulls to liquidate their long positions. With both moving averages sloping down and the RSI in the negative zone, bears still have the upper hand. We might get a clear directional move within the next few days.
XRP/USD
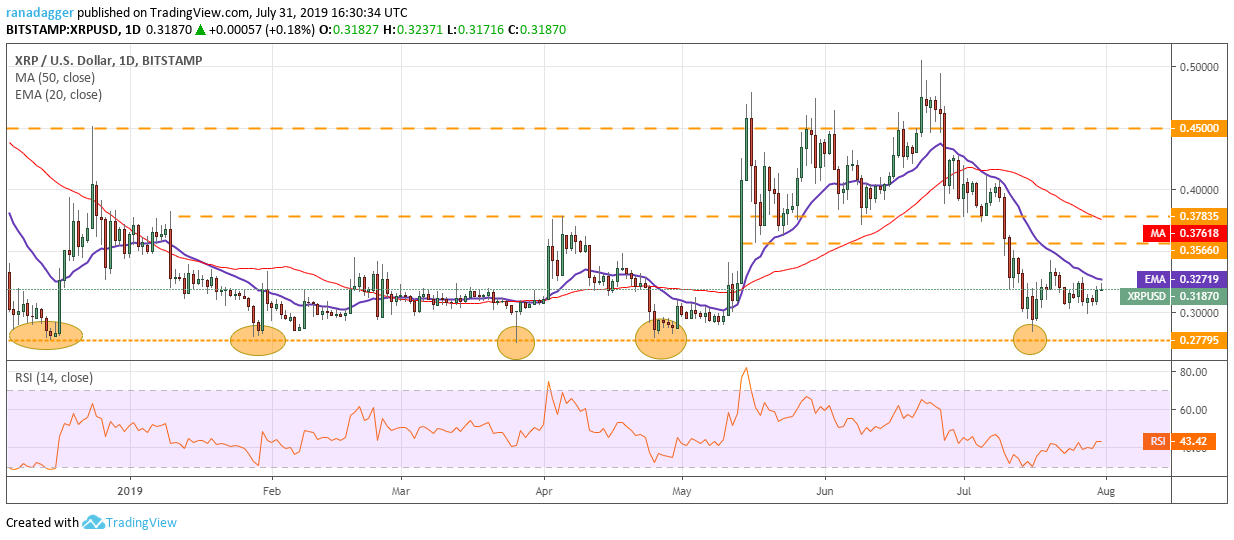
XRP has moved up to the 20-day EMA, which is the first resistance. If this is crossed, the pullback can reach $0.34229, above which we anticipate the cryptocurrency to show strength. The traders can wait for the price to close (UTC time frame) above $0.34229 before initiating long positions. The stop loss for the trade can be kept at $0.275 and the first target is a move to the 50-day SMA and above it $0.45. As the cryptocurrency is stuck in a range, allocate only 50% of the usual position size for this trade.
However, if the bulls fail to propel the XRP/USD pair above the overhead resistance, it might again slide back to $0.30, below which a retest of $0.27795 is possible. A break of $0.27795 will be a huge negative as it will trigger several stop losses and can result in a quick decline to $0.19.
LTC/USD
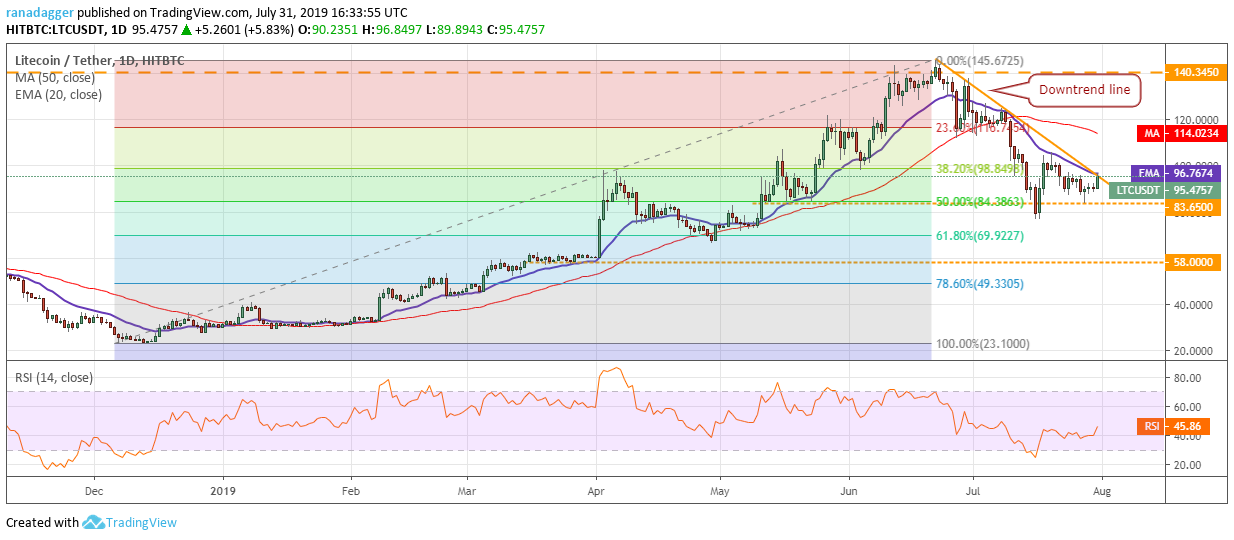
The bulls are attempting to push Litecoin (LTC) above the uptrend line. If successful, it will signal a probable change in trend. There is a minor resistance at $105.676 from where the pullback returned on July 20. After this is scaled, the cryptocurrency can move up to the 50-day SMA and above it to $140.345.
Contrary to our assumption, if the LTC/USD pair fails to break out and sustain above the downtrend line, it can again dip to $83.65. A break below $76.7143 will extend the down-move. On the other hand, if the price breaks out of the downtrend line, but fails to scale above $105.6760, it will form a range. We will suggest long positions on confirmation that the uptrend has resumed.
BCH/USD
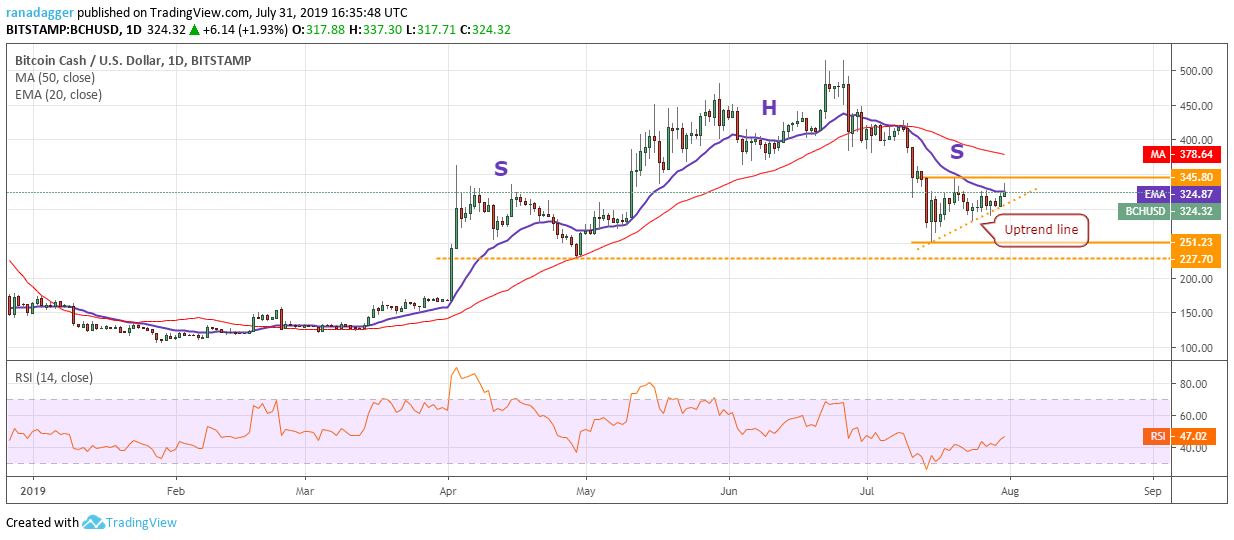
Bitcoin Cash (BCH) has risen above the 20-day EMA, which is a positive sign. If it breaks out of $345.80, it will complete an ascending triangle pattern that can carry it to $440.37. Therefore, we retain the buy recommendation given in the previous analysis.
Our assumption will be negated if bears defend the overhead resistance and sink the BCH/USD pair below the uptrend line. In such a case, a few days of range-bound action is likely. The trend will turn negative on a break below $251.23 and might enter a freefall if $227.70 cracks.
BNB/USD
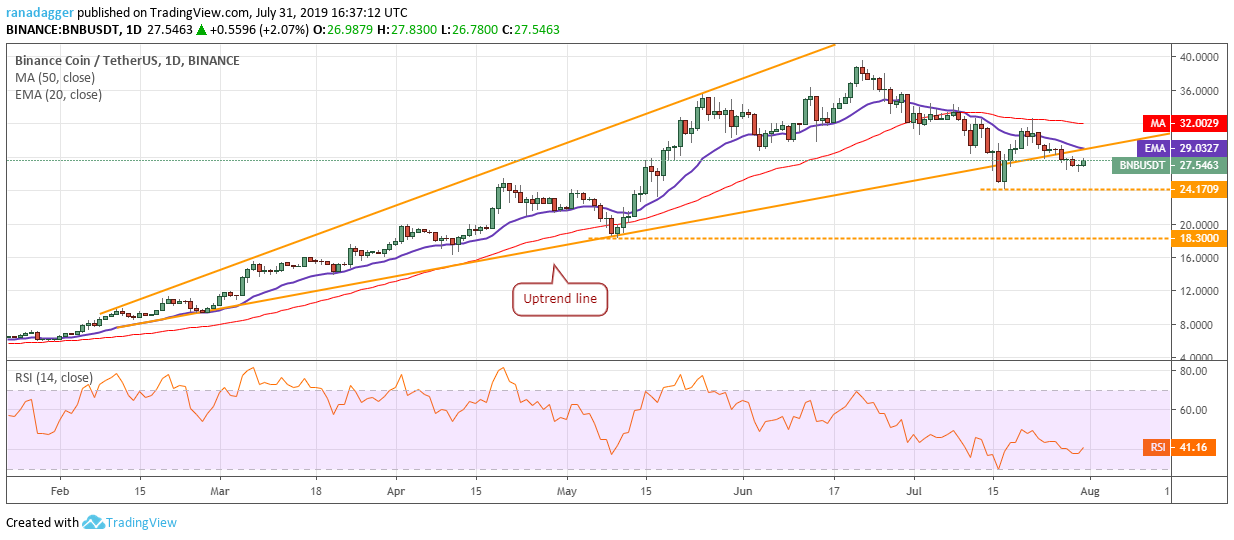
The bulls are attempting a recovery in Binance Coin (BNB). It will face resistance at the 20-day EMA, which is close to the uptrend line. If bulls scale this level and sustain it, a move to the 50-day SMA is possible. Failure of bears to capitalize on the breakdown of the uptrend line shows strong demand at lower levels.
Therefore, we might suggest long positions if the BNB/USD pair sustains above the uptrend line for three days. However, if the pair reverses direction from the 20-day EMA and breaks below $24.1709, it will indicate selling at higher levels. A break below $24.1709 can plummet it to the next support at $18.30.
EOS/USD
The small daily ranges in EOS suggest that it might enter a tight range without any clear direction. It has seen two such phases in 2019 (marked as ellipses on the chart).
Our view will be invalidated if the EOS/USD pair either breaks down of $3.30 or scales above $4.7753. A break below $3.30 can plummet the price to $2.20 while a rally above $4.775 can carry it to the 50-day SMA, above which it will start a new uptrend. As we do not have clarity on the next probable direction, we remain neutral on it.
BSV/USD
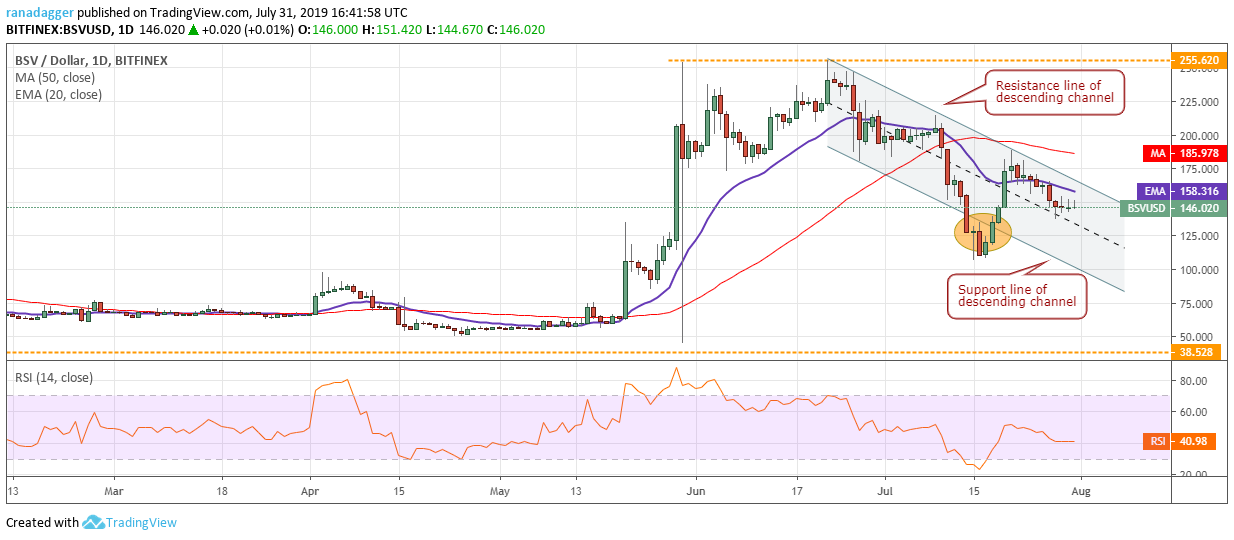
Bitcoin SV (BSV) has stayed in the upper half of the channel since July 20, which is a positive sign. However, as the price remains stuck inside the descending channel, the trend remains down.
The first sign of a trend change will be when the BSV/USD pair breaks out of the channel. It has minor resistance at $188.690, above which the pair can pick up momentum and rally to $255.620.
On the other hand, if the price fails to breakout of the channel and slips below $136.890, a retest of $107 is probable. We do not find a reliable trade setup that offers a good risk-to-reward ratio, hence, we are not proposing a trade in it.
XLM/USD
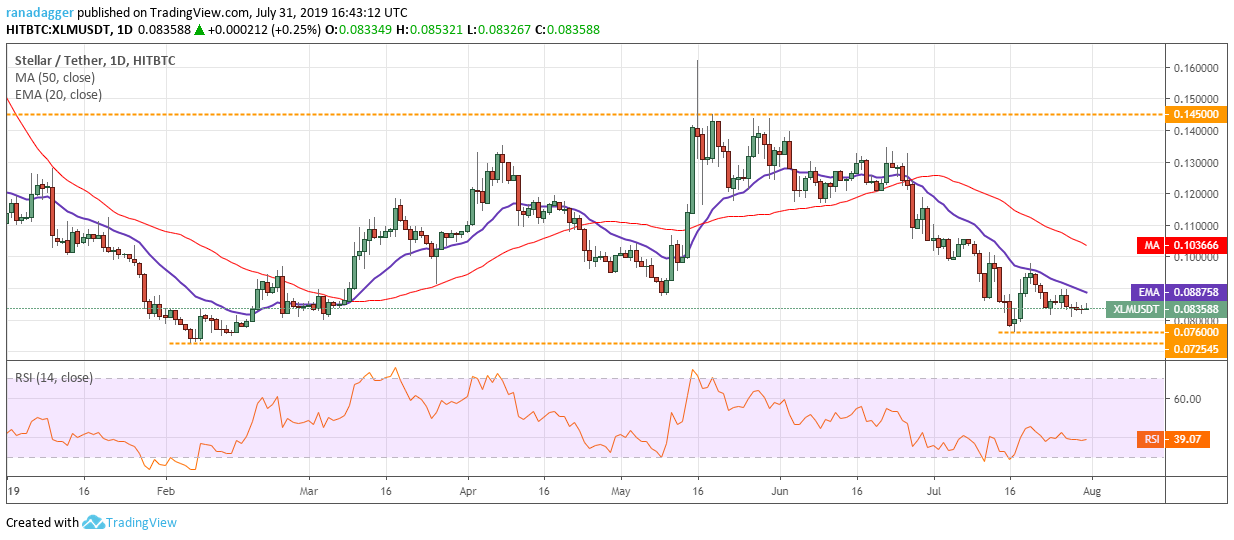
The price action of the past three days shows that neither the bulls nor the bears are taking any directional bet. This has resulted in the formation of doji candlestick pattern on all three days. This state of indecision is unlikely to remain for long. We anticipate Stellar (XLM) to either break out or break down decisively in the next few days.
The next directional move on the XLM/USD pair will happen either on a breakout of $0.10 or on a breakdown of $0.072545. If the price fails to escape these levels, the pair might end up forming a range for the next few days.
While there is no bullish setup for swing traders, investors who are willing to hold through the volatility can buy at current levels with a stop loss of $0.070. The target objective is $0.0145. Though the risk-to-reward ratio is attractive, it might test investors’ patience. Hence, we recommend keeping the position size about 50% of usual.
ADA/USD
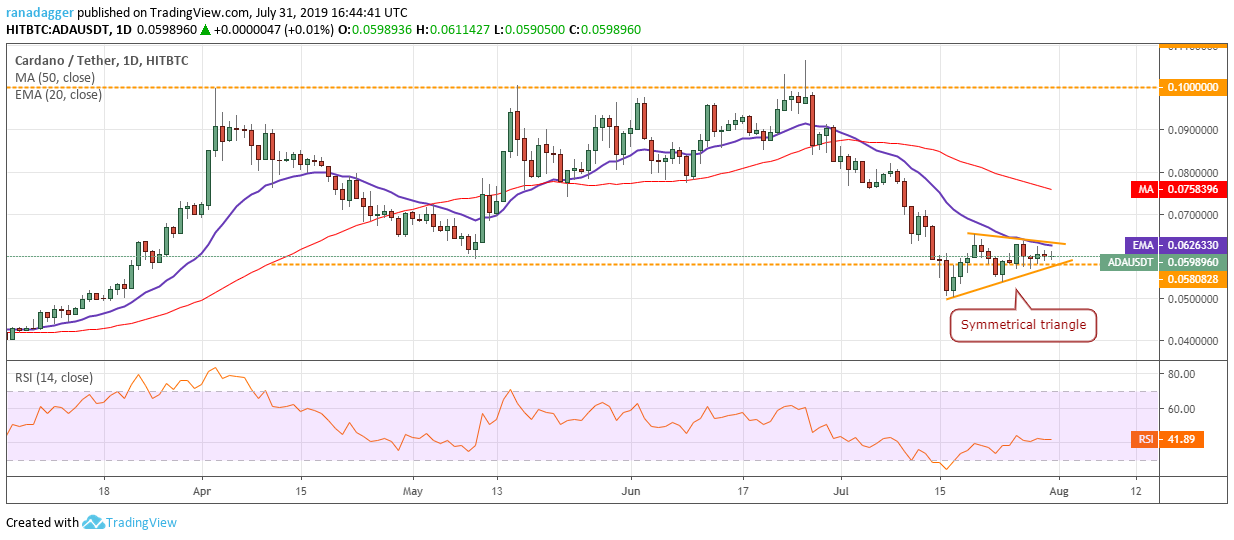
If Cardano (ADA) does not break out of the symmetrical triangle within the next couple of days, the price will reach the apex of the triangle, which will invalidate the pattern. The daily range has been shrinking for the past two days, which increases the possibility of a sharp move in either direction.
If the move happens to the downside, the ADA/USD pair will extend the decline and plummet to $0.041. Conversely, if the breakout happens to the upside, traders can initiate long positions as suggested in our previous analysis. As the pair is not in an uptrend and we are trying to take a reversal trade, we suggest traders keep the position size at 50% of usual.
Market data is provided by the HitBTC exchange.


